Immigrants from Central America vs Iraqi GED/Equivalency
COMPARE
Immigrants from Central America
Iraqi
GED/Equivalency
GED/Equivalency Comparison
Immigrants from Central America
Iraqis
76.4%
GED/EQUIVALENCY
0.0/ 100
METRIC RATING
343rd/ 347
METRIC RANK
86.2%
GED/EQUIVALENCY
75.2/ 100
METRIC RATING
155th/ 347
METRIC RANK
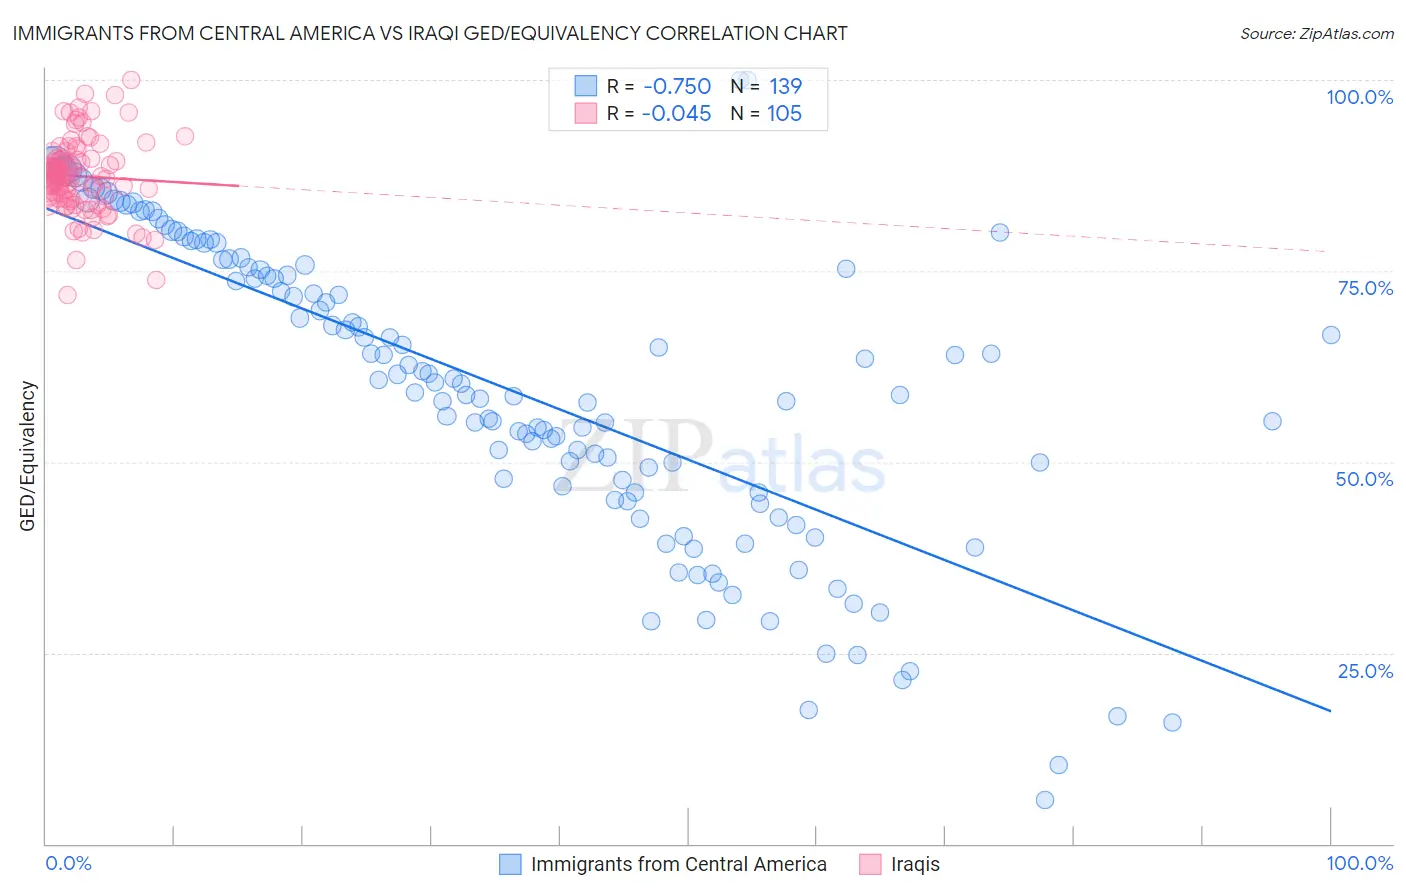
Immigrants from Central America vs Iraqi GED/Equivalency Correlation Chart
The statistical analysis conducted on geographies consisting of 536,551,827 people shows a strong negative correlation between the proportion of Immigrants from Central America and percentage of population with at least ged/equivalency education in the United States with a correlation coefficient (R) of -0.750 and weighted average of 76.4%. Similarly, the statistical analysis conducted on geographies consisting of 170,614,457 people shows no correlation between the proportion of Iraqis and percentage of population with at least ged/equivalency education in the United States with a correlation coefficient (R) of -0.045 and weighted average of 86.2%, a difference of 12.9%.
GED/Equivalency Correlation Summary
| Measurement | Immigrants from Central America | Iraqi |
| Minimum | 5.7% | 71.8% |
| Maximum | 100.0% | 100.0% |
| Range | 94.3% | 28.2% |
| Mean | 59.4% | 87.4% |
| Median | 60.3% | 87.3% |
| Interquartile 25% (IQ1) | 46.0% | 84.7% |
| Interquartile 75% (IQ3) | 75.4% | 89.7% |
| Interquartile Range (IQR) | 29.5% | 5.0% |
| Standard Deviation (Sample) | 19.9% | 4.9% |
| Standard Deviation (Population) | 19.8% | 4.9% |
Similar Demographics by GED/Equivalency
Demographics Similar to Immigrants from Central America by GED/Equivalency
In terms of ged/equivalency, the demographic groups most similar to Immigrants from Central America are Spanish American Indian (76.3%, a difference of 0.030%), Pima (76.4%, a difference of 0.090%), Immigrants from Mexico (75.7%, a difference of 0.92%), Mexican (77.4%, a difference of 1.4%), and Tohono O'odham (77.5%, a difference of 1.5%).
| Demographics | Rating | Rank | GED/Equivalency |
| Salvadorans | 0.0 /100 | #333 | Tragic 78.6% |
| Guatemalans | 0.0 /100 | #334 | Tragic 78.5% |
| Immigrants | Latin America | 0.0 /100 | #335 | Tragic 78.5% |
| Immigrants | Dominican Republic | 0.0 /100 | #336 | Tragic 78.0% |
| Immigrants | Yemen | 0.0 /100 | #337 | Tragic 77.9% |
| Immigrants | Guatemala | 0.0 /100 | #338 | Tragic 77.9% |
| Immigrants | El Salvador | 0.0 /100 | #339 | Tragic 77.6% |
| Tohono O'odham | 0.0 /100 | #340 | Tragic 77.5% |
| Mexicans | 0.0 /100 | #341 | Tragic 77.4% |
| Pima | 0.0 /100 | #342 | Tragic 76.4% |
| Immigrants | Central America | 0.0 /100 | #343 | Tragic 76.4% |
| Spanish American Indians | 0.0 /100 | #344 | Tragic 76.3% |
| Immigrants | Mexico | 0.0 /100 | #345 | Tragic 75.7% |
| Houma | 0.0 /100 | #346 | Tragic 75.0% |
| Yakama | 0.0 /100 | #347 | Tragic 74.5% |
Demographics Similar to Iraqis by GED/Equivalency
In terms of ged/equivalency, the demographic groups most similar to Iraqis are Armenian (86.3%, a difference of 0.030%), Kenyan (86.3%, a difference of 0.040%), Immigrants from Nepal (86.2%, a difference of 0.050%), Brazilian (86.3%, a difference of 0.060%), and Immigrants from Bosnia and Herzegovina (86.3%, a difference of 0.080%).
| Demographics | Rating | Rank | GED/Equivalency |
| Immigrants | Poland | 79.3 /100 | #148 | Good 86.3% |
| Menominee | 79.3 /100 | #149 | Good 86.3% |
| Immigrants | Western Asia | 78.8 /100 | #150 | Good 86.3% |
| Immigrants | Bosnia and Herzegovina | 77.9 /100 | #151 | Good 86.3% |
| Brazilians | 77.2 /100 | #152 | Good 86.3% |
| Kenyans | 76.6 /100 | #153 | Good 86.3% |
| Armenians | 76.4 /100 | #154 | Good 86.3% |
| Iraqis | 75.2 /100 | #155 | Good 86.2% |
| Immigrants | Nepal | 73.3 /100 | #156 | Good 86.2% |
| Whites/Caucasians | 72.2 /100 | #157 | Good 86.2% |
| German Russians | 72.1 /100 | #158 | Good 86.2% |
| Immigrants | Kenya | 71.8 /100 | #159 | Good 86.2% |
| Immigrants | Morocco | 69.5 /100 | #160 | Good 86.1% |
| Immigrants | Syria | 69.3 /100 | #161 | Good 86.1% |
| Immigrants | Iraq | 68.1 /100 | #162 | Good 86.1% |