Immigrants from Central America vs Serbian 9th Grade
COMPARE
Immigrants from Central America
Serbian
9th Grade
9th Grade Comparison
Immigrants from Central America
Serbians
89.0%
9TH GRADE
0.0/ 100
METRIC RATING
345th/ 347
METRIC RANK
96.0%
9TH GRADE
99.9/ 100
METRIC RATING
52nd/ 347
METRIC RANK
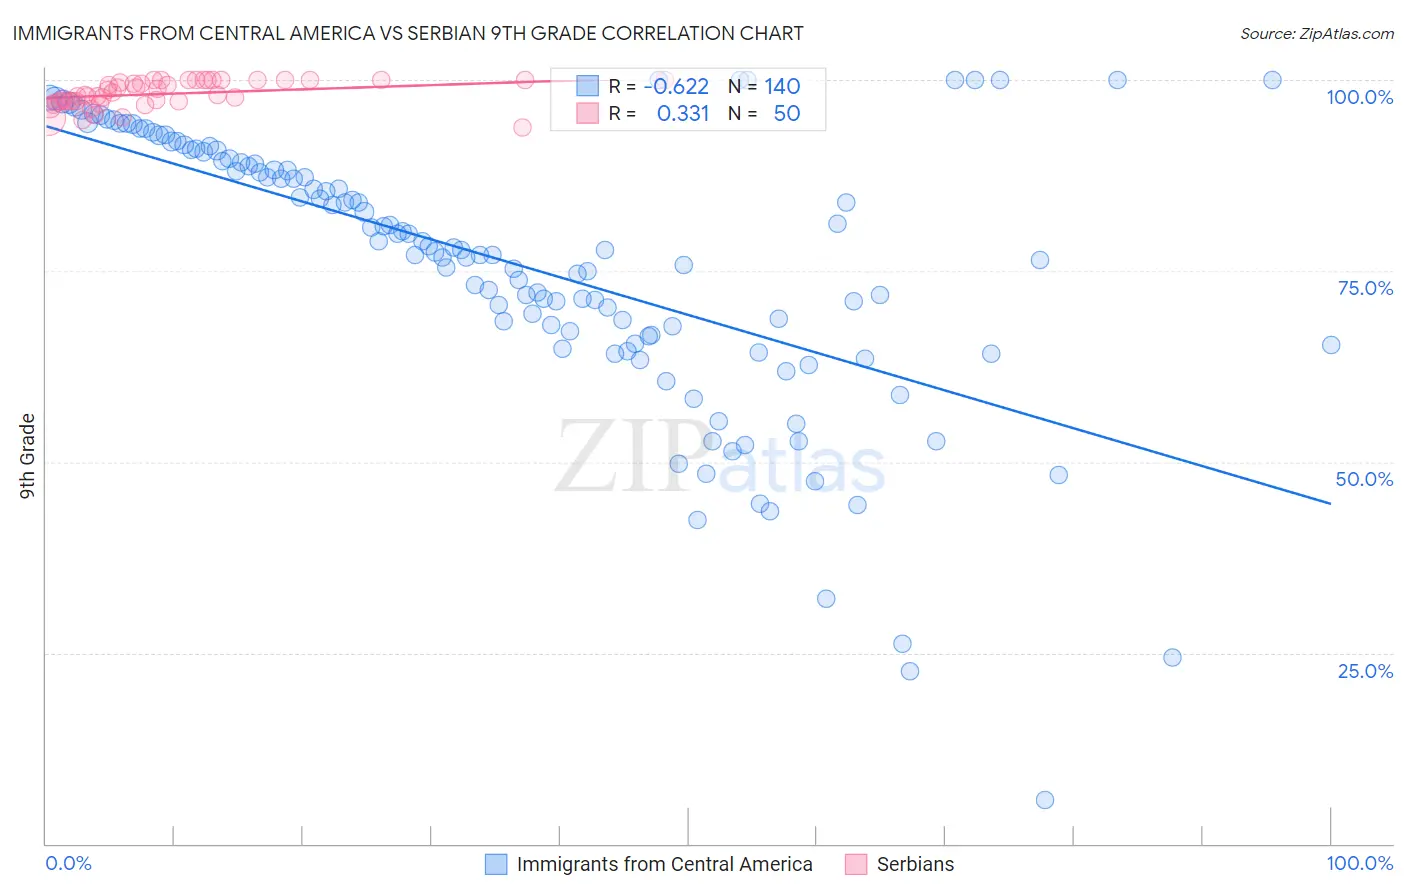
Immigrants from Central America vs Serbian 9th Grade Correlation Chart
The statistical analysis conducted on geographies consisting of 536,553,738 people shows a significant negative correlation between the proportion of Immigrants from Central America and percentage of population with at least 9th grade education in the United States with a correlation coefficient (R) of -0.622 and weighted average of 89.0%. Similarly, the statistical analysis conducted on geographies consisting of 267,641,806 people shows a mild positive correlation between the proportion of Serbians and percentage of population with at least 9th grade education in the United States with a correlation coefficient (R) of 0.331 and weighted average of 96.0%, a difference of 7.9%.
9th Grade Correlation Summary
| Measurement | Immigrants from Central America | Serbian |
| Minimum | 5.7% | 93.8% |
| Maximum | 100.0% | 100.0% |
| Range | 94.3% | 6.2% |
| Mean | 76.0% | 98.2% |
| Median | 77.9% | 98.0% |
| Interquartile 25% (IQ1) | 66.5% | 97.2% |
| Interquartile 75% (IQ3) | 90.1% | 100.0% |
| Interquartile Range (IQR) | 23.6% | 2.8% |
| Standard Deviation (Sample) | 18.1% | 1.7% |
| Standard Deviation (Population) | 18.0% | 1.6% |
Similar Demographics by 9th Grade
Demographics Similar to Immigrants from Central America by 9th Grade
In terms of 9th grade, the demographic groups most similar to Immigrants from Central America are Immigrants from El Salvador (89.0%, a difference of 0.020%), Immigrants from Mexico (88.7%, a difference of 0.34%), Immigrants from Guatemala (89.4%, a difference of 0.53%), Salvadoran (89.6%, a difference of 0.73%), and Spanish American Indian (88.3%, a difference of 0.77%).
| Demographics | Rating | Rank | 9th Grade |
| Immigrants | Yemen | 0.0 /100 | #333 | Tragic 90.8% |
| Immigrants | Azores | 0.0 /100 | #334 | Tragic 90.8% |
| Immigrants | Honduras | 0.0 /100 | #335 | Tragic 90.6% |
| Immigrants | Dominican Republic | 0.0 /100 | #336 | Tragic 90.5% |
| Immigrants | Latin America | 0.0 /100 | #337 | Tragic 90.4% |
| Central Americans | 0.0 /100 | #338 | Tragic 90.4% |
| Yakama | 0.0 /100 | #339 | Tragic 90.1% |
| Mexicans | 0.0 /100 | #340 | Tragic 90.0% |
| Guatemalans | 0.0 /100 | #341 | Tragic 89.9% |
| Salvadorans | 0.0 /100 | #342 | Tragic 89.6% |
| Immigrants | Guatemala | 0.0 /100 | #343 | Tragic 89.4% |
| Immigrants | El Salvador | 0.0 /100 | #344 | Tragic 89.0% |
| Immigrants | Central America | 0.0 /100 | #345 | Tragic 89.0% |
| Immigrants | Mexico | 0.0 /100 | #346 | Tragic 88.7% |
| Spanish American Indians | 0.0 /100 | #347 | Tragic 88.3% |
Demographics Similar to Serbians by 9th Grade
In terms of 9th grade, the demographic groups most similar to Serbians are Immigrants from Northern Europe (96.0%, a difference of 0.0%), Austrian (96.0%, a difference of 0.010%), Celtic (96.0%, a difference of 0.020%), Immigrants from Canada (96.0%, a difference of 0.020%), and Greek (96.0%, a difference of 0.030%).
| Demographics | Rating | Rank | 9th Grade |
| Crow | 99.9 /100 | #45 | Exceptional 96.1% |
| Immigrants | India | 99.9 /100 | #46 | Exceptional 96.1% |
| Russians | 99.9 /100 | #47 | Exceptional 96.0% |
| Australians | 99.9 /100 | #48 | Exceptional 96.0% |
| Greeks | 99.9 /100 | #49 | Exceptional 96.0% |
| Celtics | 99.9 /100 | #50 | Exceptional 96.0% |
| Immigrants | Northern Europe | 99.9 /100 | #51 | Exceptional 96.0% |
| Serbians | 99.9 /100 | #52 | Exceptional 96.0% |
| Austrians | 99.8 /100 | #53 | Exceptional 96.0% |
| Immigrants | Canada | 99.8 /100 | #54 | Exceptional 96.0% |
| Immigrants | Austria | 99.8 /100 | #55 | Exceptional 96.0% |
| Immigrants | North America | 99.8 /100 | #56 | Exceptional 96.0% |
| Macedonians | 99.8 /100 | #57 | Exceptional 96.0% |
| Aleuts | 99.8 /100 | #58 | Exceptional 96.0% |
| New Zealanders | 99.8 /100 | #59 | Exceptional 95.9% |