Immigrants from Czechoslovakia vs Immigrants from St. Vincent and the Grenadines No Schooling Completed
COMPARE
Immigrants from Czechoslovakia
Immigrants from St. Vincent and the Grenadines
No Schooling Completed
No Schooling Completed Comparison
Immigrants from Czechoslovakia
Immigrants from St. Vincent and the Grenadines
1.8%
NO SCHOOLING COMPLETED
97.9/ 100
METRIC RATING
101st/ 347
METRIC RANK
2.7%
NO SCHOOLING COMPLETED
0.0/ 100
METRIC RATING
288th/ 347
METRIC RANK
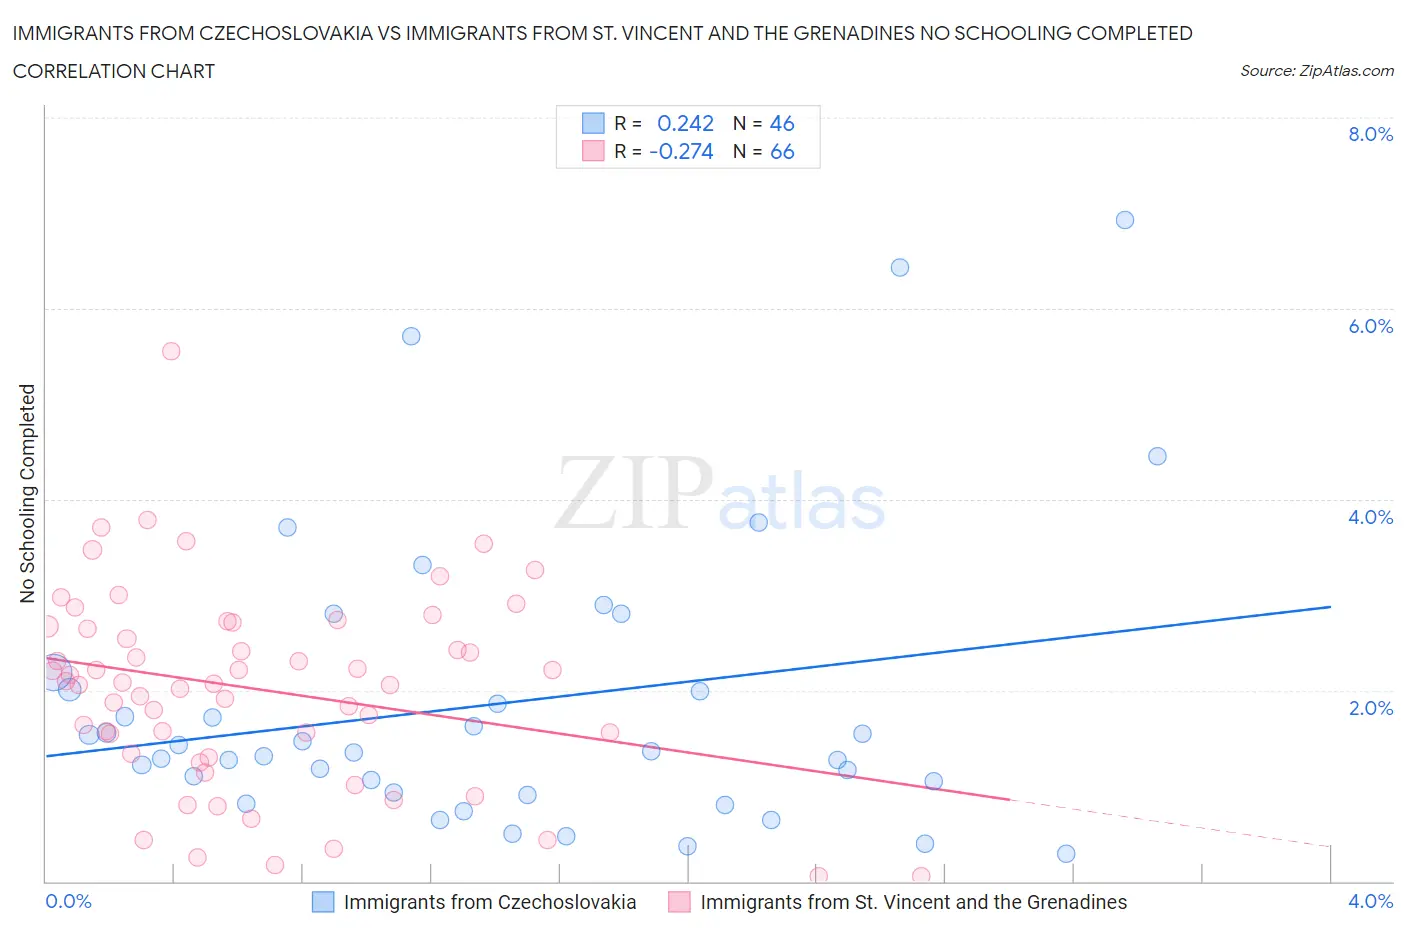
Immigrants from Czechoslovakia vs Immigrants from St. Vincent and the Grenadines No Schooling Completed Correlation Chart
The statistical analysis conducted on geographies consisting of 194,474,881 people shows a weak positive correlation between the proportion of Immigrants from Czechoslovakia and percentage of population with no schooling in the United States with a correlation coefficient (R) of 0.242 and weighted average of 1.8%. Similarly, the statistical analysis conducted on geographies consisting of 56,079,309 people shows a weak negative correlation between the proportion of Immigrants from St. Vincent and the Grenadines and percentage of population with no schooling in the United States with a correlation coefficient (R) of -0.274 and weighted average of 2.7%, a difference of 47.8%.
No Schooling Completed Correlation Summary
| Measurement | Immigrants from Czechoslovakia | Immigrants from St. Vincent and the Grenadines |
| Minimum | 0.29% | 0.050% |
| Maximum | 6.9% | 5.6% |
| Range | 6.6% | 5.5% |
| Mean | 1.9% | 2.0% |
| Median | 1.4% | 2.1% |
| Interquartile 25% (IQ1) | 0.93% | 1.3% |
| Interquartile 75% (IQ3) | 2.0% | 2.7% |
| Interquartile Range (IQR) | 1.1% | 1.3% |
| Standard Deviation (Sample) | 1.5% | 1.0% |
| Standard Deviation (Population) | 1.5% | 1.0% |
Similar Demographics by No Schooling Completed
Demographics Similar to Immigrants from Czechoslovakia by No Schooling Completed
In terms of no schooling completed, the demographic groups most similar to Immigrants from Czechoslovakia are Immigrants from Switzerland (1.8%, a difference of 0.0%), Basque (1.8%, a difference of 0.060%), Immigrants from Singapore (1.8%, a difference of 0.30%), Choctaw (1.8%, a difference of 0.49%), and Thai (1.8%, a difference of 0.63%).
| Demographics | Rating | Rank | No Schooling Completed |
| Immigrants | Nonimmigrants | 98.5 /100 | #94 | Exceptional 1.8% |
| Puget Sound Salish | 98.5 /100 | #95 | Exceptional 1.8% |
| Bhutanese | 98.4 /100 | #96 | Exceptional 1.8% |
| Immigrants | Ireland | 98.4 /100 | #97 | Exceptional 1.8% |
| Iranians | 98.2 /100 | #98 | Exceptional 1.8% |
| Choctaw | 98.1 /100 | #99 | Exceptional 1.8% |
| Immigrants | Singapore | 98.0 /100 | #100 | Exceptional 1.8% |
| Immigrants | Czechoslovakia | 97.9 /100 | #101 | Exceptional 1.8% |
| Immigrants | Switzerland | 97.9 /100 | #102 | Exceptional 1.8% |
| Basques | 97.9 /100 | #103 | Exceptional 1.8% |
| Thais | 97.5 /100 | #104 | Exceptional 1.8% |
| German Russians | 97.5 /100 | #105 | Exceptional 1.8% |
| Immigrants | France | 97.3 /100 | #106 | Exceptional 1.8% |
| Yugoslavians | 97.2 /100 | #107 | Exceptional 1.8% |
| Okinawans | 97.1 /100 | #108 | Exceptional 1.8% |
Demographics Similar to Immigrants from St. Vincent and the Grenadines by No Schooling Completed
In terms of no schooling completed, the demographic groups most similar to Immigrants from St. Vincent and the Grenadines are Immigrants from Afghanistan (2.7%, a difference of 0.10%), Immigrants from Thailand (2.7%, a difference of 0.32%), Immigrants from Hong Kong (2.7%, a difference of 0.38%), Immigrants from Portugal (2.7%, a difference of 0.91%), and British West Indian (2.7%, a difference of 1.3%).
| Demographics | Rating | Rank | No Schooling Completed |
| Afghans | 0.1 /100 | #281 | Tragic 2.6% |
| Immigrants | Ghana | 0.1 /100 | #282 | Tragic 2.6% |
| Immigrants | Trinidad and Tobago | 0.0 /100 | #283 | Tragic 2.6% |
| Immigrants | West Indies | 0.0 /100 | #284 | Tragic 2.7% |
| Immigrants | Barbados | 0.0 /100 | #285 | Tragic 2.7% |
| Immigrants | Portugal | 0.0 /100 | #286 | Tragic 2.7% |
| Immigrants | Afghanistan | 0.0 /100 | #287 | Tragic 2.7% |
| Immigrants | St. Vincent and the Grenadines | 0.0 /100 | #288 | Tragic 2.7% |
| Immigrants | Thailand | 0.0 /100 | #289 | Tragic 2.7% |
| Immigrants | Hong Kong | 0.0 /100 | #290 | Tragic 2.7% |
| British West Indians | 0.0 /100 | #291 | Tragic 2.7% |
| Immigrants | Grenada | 0.0 /100 | #292 | Tragic 2.8% |
| Malaysians | 0.0 /100 | #293 | Tragic 2.8% |
| Immigrants | Eritrea | 0.0 /100 | #294 | Tragic 2.8% |
| Houma | 0.0 /100 | #295 | Tragic 2.8% |