Immigrants from Dominican Republic vs Choctaw Nursery School
COMPARE
Immigrants from Dominican Republic
Choctaw
Nursery School
Nursery School Comparison
Immigrants from Dominican Republic
Choctaw
96.6%
NURSERY SCHOOL
0.0/ 100
METRIC RATING
334th/ 347
METRIC RANK
98.3%
NURSERY SCHOOL
98.3/ 100
METRIC RATING
98th/ 347
METRIC RANK
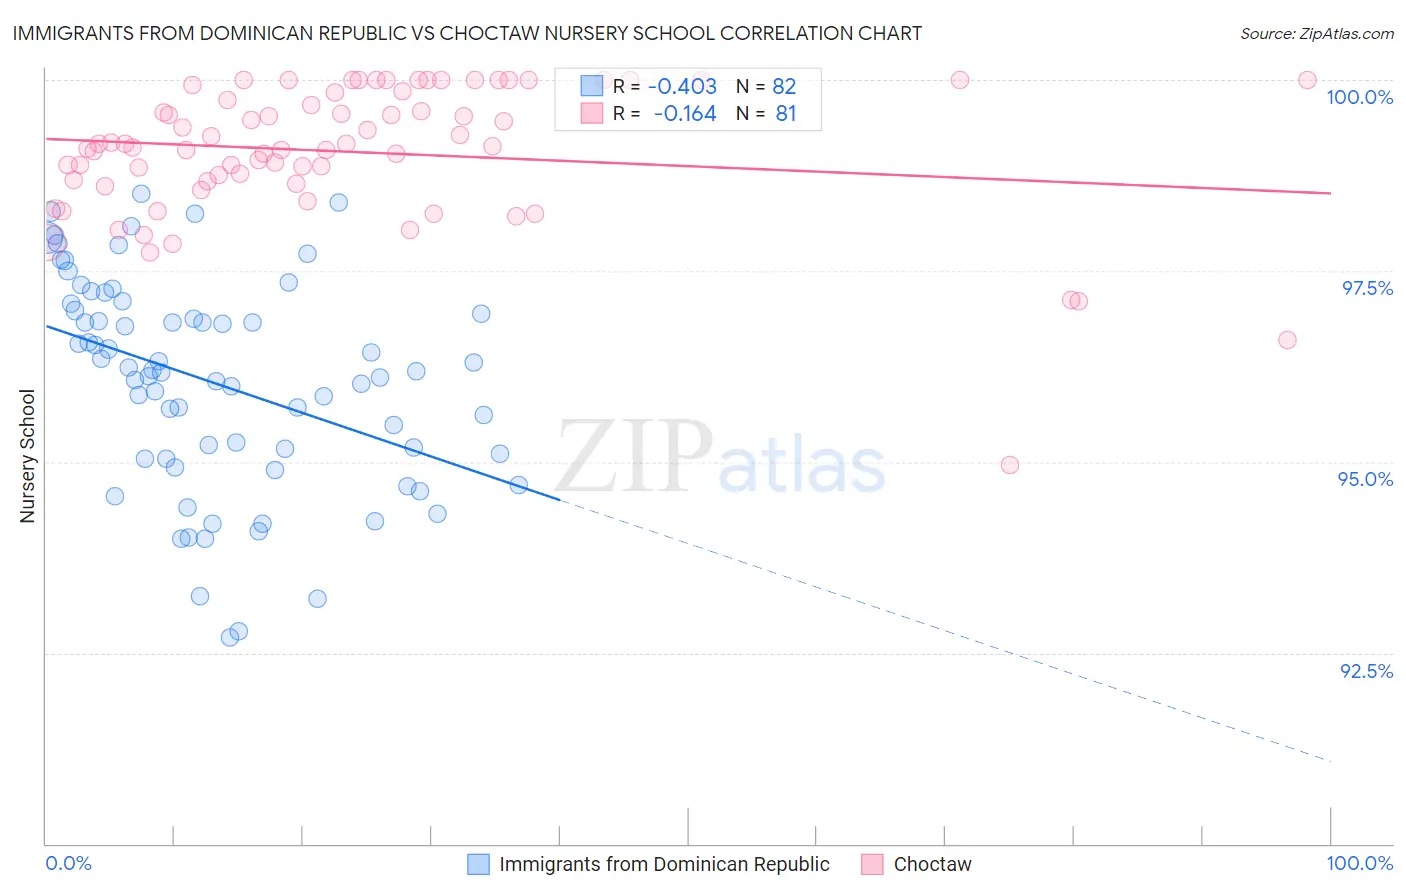
Immigrants from Dominican Republic vs Choctaw Nursery School Correlation Chart
The statistical analysis conducted on geographies consisting of 275,142,551 people shows a moderate negative correlation between the proportion of Immigrants from Dominican Republic and percentage of population with at least nursery school education in the United States with a correlation coefficient (R) of -0.403 and weighted average of 96.6%. Similarly, the statistical analysis conducted on geographies consisting of 269,742,875 people shows a poor negative correlation between the proportion of Choctaw and percentage of population with at least nursery school education in the United States with a correlation coefficient (R) of -0.164 and weighted average of 98.3%, a difference of 1.7%.
Nursery School Correlation Summary
| Measurement | Immigrants from Dominican Republic | Choctaw |
| Minimum | 92.7% | 95.0% |
| Maximum | 98.5% | 100.0% |
| Range | 5.8% | 5.0% |
| Mean | 96.0% | 99.1% |
| Median | 96.2% | 99.1% |
| Interquartile 25% (IQ1) | 95.0% | 98.7% |
| Interquartile 75% (IQ3) | 97.0% | 99.8% |
| Interquartile Range (IQR) | 1.9% | 1.2% |
| Standard Deviation (Sample) | 1.4% | 0.90% |
| Standard Deviation (Population) | 1.4% | 0.90% |
Similar Demographics by Nursery School
Demographics Similar to Immigrants from Dominican Republic by Nursery School
In terms of nursery school, the demographic groups most similar to Immigrants from Dominican Republic are Central American (96.6%, a difference of 0.010%), Yakama (96.6%, a difference of 0.030%), Bangladeshi (96.6%, a difference of 0.030%), Immigrants from Armenia (96.7%, a difference of 0.050%), and Guatemalan (96.6%, a difference of 0.050%).
| Demographics | Rating | Rank | Nursery School |
| Mexicans | 0.0 /100 | #327 | Tragic 96.8% |
| Immigrants | Latin America | 0.0 /100 | #328 | Tragic 96.7% |
| Immigrants | Vietnam | 0.0 /100 | #329 | Tragic 96.7% |
| Japanese | 0.0 /100 | #330 | Tragic 96.7% |
| Immigrants | Armenia | 0.0 /100 | #331 | Tragic 96.7% |
| Yakama | 0.0 /100 | #332 | Tragic 96.6% |
| Central Americans | 0.0 /100 | #333 | Tragic 96.6% |
| Immigrants | Dominican Republic | 0.0 /100 | #334 | Tragic 96.6% |
| Bangladeshis | 0.0 /100 | #335 | Tragic 96.6% |
| Guatemalans | 0.0 /100 | #336 | Tragic 96.6% |
| Immigrants | Cambodia | 0.0 /100 | #337 | Tragic 96.5% |
| Immigrants | Fiji | 0.0 /100 | #338 | Tragic 96.5% |
| Immigrants | Guatemala | 0.0 /100 | #339 | Tragic 96.4% |
| Immigrants | Central America | 0.0 /100 | #340 | Tragic 96.4% |
| Immigrants | Cabo Verde | 0.0 /100 | #341 | Tragic 96.4% |
Demographics Similar to Choctaw by Nursery School
In terms of nursery school, the demographic groups most similar to Choctaw are Cypriot (98.3%, a difference of 0.0%), Nonimmigrants (98.3%, a difference of 0.0%), Colville (98.3%, a difference of 0.0%), Immigrants from Germany (98.3%, a difference of 0.010%), and South African (98.3%, a difference of 0.010%).
| Demographics | Rating | Rank | Nursery School |
| Zimbabweans | 98.8 /100 | #91 | Exceptional 98.3% |
| Macedonians | 98.7 /100 | #92 | Exceptional 98.3% |
| Immigrants | India | 98.7 /100 | #93 | Exceptional 98.3% |
| Immigrants | Germany | 98.6 /100 | #94 | Exceptional 98.3% |
| South Africans | 98.6 /100 | #95 | Exceptional 98.3% |
| Cypriots | 98.3 /100 | #96 | Exceptional 98.3% |
| Immigrants | Nonimmigrants | 98.3 /100 | #97 | Exceptional 98.3% |
| Choctaw | 98.3 /100 | #98 | Exceptional 98.3% |
| Colville | 98.2 /100 | #99 | Exceptional 98.3% |
| Puget Sound Salish | 98.0 /100 | #100 | Exceptional 98.3% |
| Romanians | 97.9 /100 | #101 | Exceptional 98.3% |
| Immigrants | Ireland | 97.7 /100 | #102 | Exceptional 98.3% |
| Cree | 97.7 /100 | #103 | Exceptional 98.3% |
| Bhutanese | 97.4 /100 | #104 | Exceptional 98.2% |
| Turks | 97.4 /100 | #105 | Exceptional 98.2% |