Immigrants from Fiji vs Dutch Associate's Degree
COMPARE
Immigrants from Fiji
Dutch
Associate's Degree
Associate's Degree Comparison
Immigrants from Fiji
Dutch
42.2%
ASSOCIATE'S DEGREE
0.8/ 100
METRIC RATING
247th/ 347
METRIC RANK
45.0%
ASSOCIATE'S DEGREE
17.6/ 100
METRIC RATING
208th/ 347
METRIC RANK
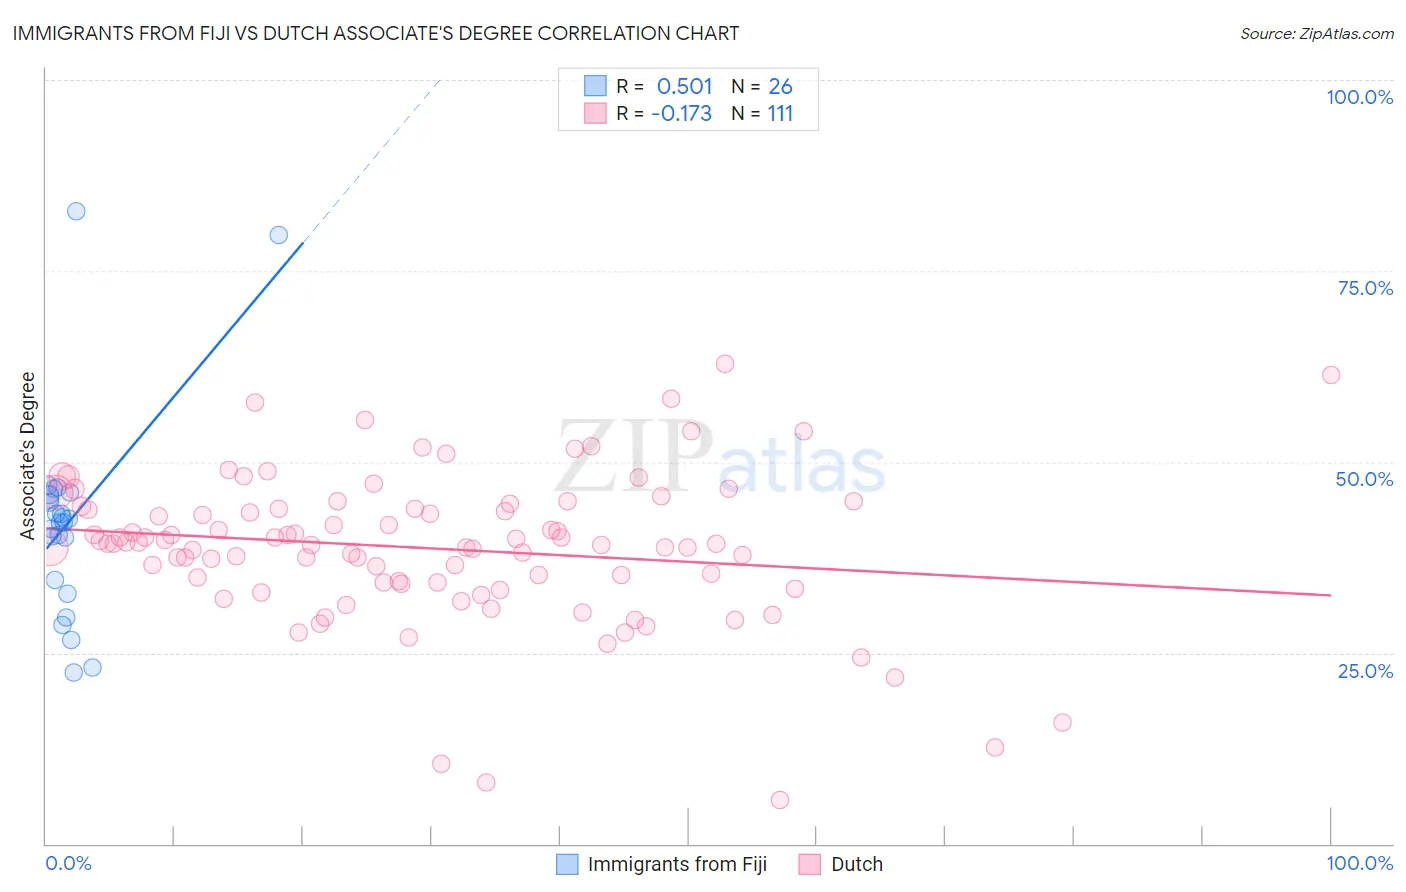
Immigrants from Fiji vs Dutch Associate's Degree Correlation Chart
The statistical analysis conducted on geographies consisting of 93,756,204 people shows a substantial positive correlation between the proportion of Immigrants from Fiji and percentage of population with at least associate's degree education in the United States with a correlation coefficient (R) of 0.501 and weighted average of 42.2%. Similarly, the statistical analysis conducted on geographies consisting of 554,303,410 people shows a poor negative correlation between the proportion of Dutch and percentage of population with at least associate's degree education in the United States with a correlation coefficient (R) of -0.173 and weighted average of 45.0%, a difference of 6.6%.
Associate's Degree Correlation Summary
| Measurement | Immigrants from Fiji | Dutch |
| Minimum | 22.5% | 5.7% |
| Maximum | 82.8% | 62.9% |
| Range | 60.3% | 57.2% |
| Mean | 42.3% | 38.7% |
| Median | 42.3% | 39.3% |
| Interquartile 25% (IQ1) | 34.6% | 34.2% |
| Interquartile 75% (IQ3) | 45.7% | 43.9% |
| Interquartile Range (IQR) | 11.1% | 9.8% |
| Standard Deviation (Sample) | 13.7% | 9.9% |
| Standard Deviation (Population) | 13.4% | 9.8% |
Similar Demographics by Associate's Degree
Demographics Similar to Immigrants from Fiji by Associate's Degree
In terms of associate's degree, the demographic groups most similar to Immigrants from Fiji are Delaware (42.3%, a difference of 0.090%), Immigrants from Ecuador (42.2%, a difference of 0.090%), Immigrants from Cambodia (42.3%, a difference of 0.12%), Immigrants from Liberia (42.3%, a difference of 0.14%), and Jamaican (42.1%, a difference of 0.23%).
| Demographics | Rating | Rank | Associate's Degree |
| Cree | 1.2 /100 | #240 | Tragic 42.5% |
| British West Indians | 1.0 /100 | #241 | Tragic 42.4% |
| Immigrants | West Indies | 1.0 /100 | #242 | Tragic 42.4% |
| Guyanese | 1.0 /100 | #243 | Tragic 42.3% |
| Immigrants | Liberia | 0.9 /100 | #244 | Tragic 42.3% |
| Immigrants | Cambodia | 0.9 /100 | #245 | Tragic 42.3% |
| Delaware | 0.9 /100 | #246 | Tragic 42.3% |
| Immigrants | Fiji | 0.8 /100 | #247 | Tragic 42.2% |
| Immigrants | Ecuador | 0.8 /100 | #248 | Tragic 42.2% |
| Jamaicans | 0.7 /100 | #249 | Tragic 42.1% |
| U.S. Virgin Islanders | 0.7 /100 | #250 | Tragic 42.1% |
| Immigrants | Bahamas | 0.7 /100 | #251 | Tragic 42.1% |
| French American Indians | 0.6 /100 | #252 | Tragic 42.0% |
| Indonesians | 0.6 /100 | #253 | Tragic 41.9% |
| Cubans | 0.6 /100 | #254 | Tragic 41.9% |
Demographics Similar to Dutch by Associate's Degree
In terms of associate's degree, the demographic groups most similar to Dutch are Panamanian (45.1%, a difference of 0.10%), Immigrants from Costa Rica (45.0%, a difference of 0.11%), Immigrants from Philippines (45.0%, a difference of 0.12%), Immigrants from Zaire (45.0%, a difference of 0.13%), and Immigrants from Thailand (45.1%, a difference of 0.17%).
| Demographics | Rating | Rank | Associate's Degree |
| Immigrants | Vietnam | 20.8 /100 | #201 | Fair 45.2% |
| Spaniards | 20.4 /100 | #202 | Fair 45.2% |
| Immigrants | South Eastern Asia | 20.2 /100 | #203 | Fair 45.2% |
| Nigerians | 19.1 /100 | #204 | Poor 45.1% |
| Immigrants | Thailand | 18.9 /100 | #205 | Poor 45.1% |
| German Russians | 18.9 /100 | #206 | Poor 45.1% |
| Panamanians | 18.4 /100 | #207 | Poor 45.1% |
| Dutch | 17.6 /100 | #208 | Poor 45.0% |
| Immigrants | Costa Rica | 16.7 /100 | #209 | Poor 45.0% |
| Immigrants | Philippines | 16.7 /100 | #210 | Poor 45.0% |
| Immigrants | Zaire | 16.6 /100 | #211 | Poor 45.0% |
| French Canadians | 15.0 /100 | #212 | Poor 44.9% |
| Immigrants | Ghana | 14.2 /100 | #213 | Poor 44.8% |
| Immigrants | Middle Africa | 12.7 /100 | #214 | Poor 44.7% |
| Immigrants | Panama | 12.4 /100 | #215 | Poor 44.7% |