Immigrants from Grenada vs Kenyan 11th Grade
COMPARE
Immigrants from Grenada
Kenyan
11th Grade
11th Grade Comparison
Immigrants from Grenada
Kenyans
90.1%
11TH GRADE
0.0/ 100
METRIC RATING
294th/ 347
METRIC RANK
92.9%
11TH GRADE
82.0/ 100
METRIC RATING
142nd/ 347
METRIC RANK
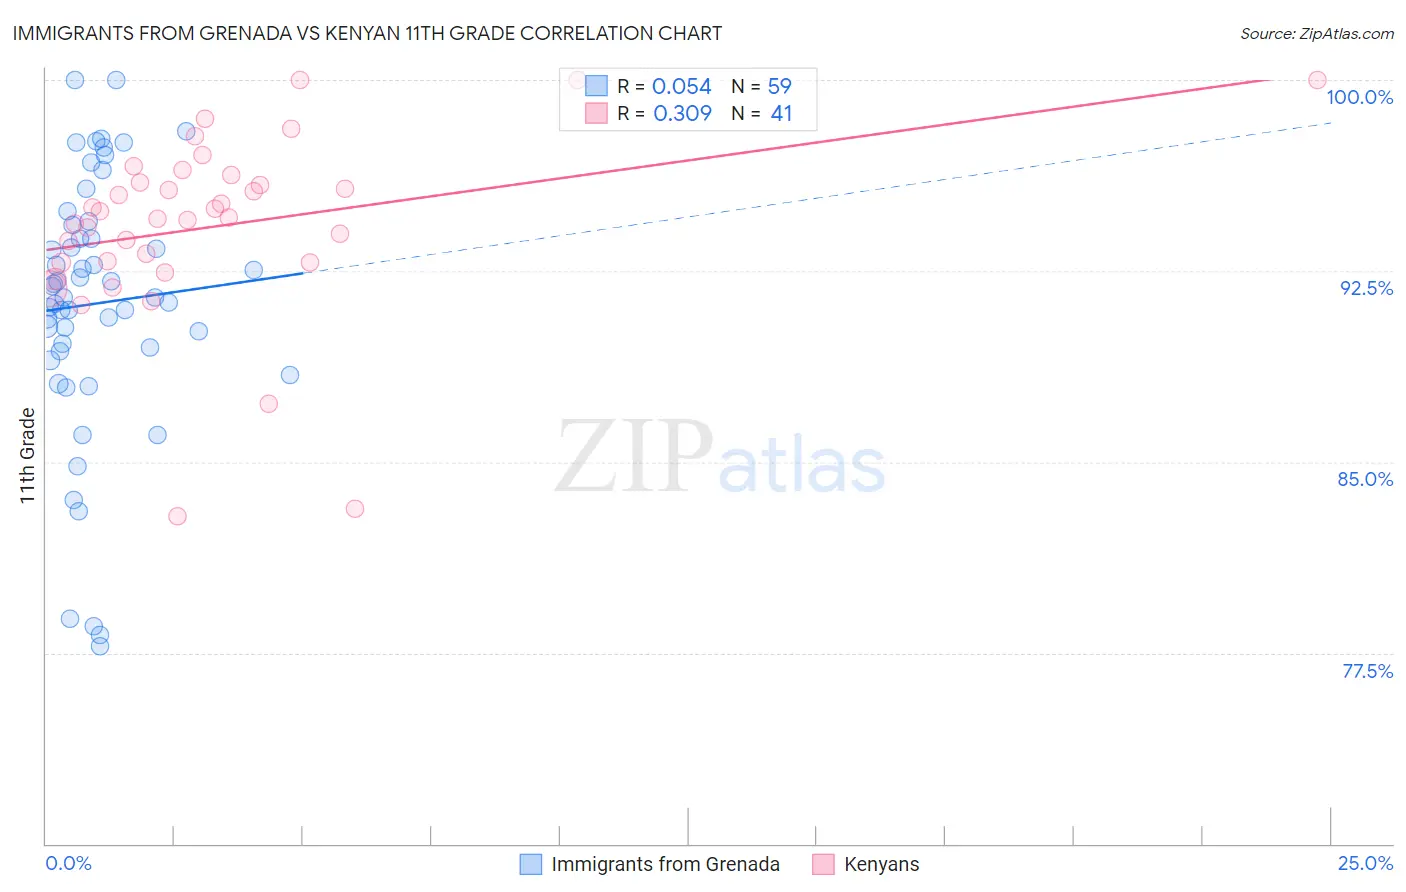
Immigrants from Grenada vs Kenyan 11th Grade Correlation Chart
The statistical analysis conducted on geographies consisting of 67,201,908 people shows a slight positive correlation between the proportion of Immigrants from Grenada and percentage of population with at least 11th grade education in the United States with a correlation coefficient (R) of 0.054 and weighted average of 90.1%. Similarly, the statistical analysis conducted on geographies consisting of 168,244,042 people shows a mild positive correlation between the proportion of Kenyans and percentage of population with at least 11th grade education in the United States with a correlation coefficient (R) of 0.309 and weighted average of 92.9%, a difference of 3.0%.
11th Grade Correlation Summary
| Measurement | Immigrants from Grenada | Kenyan |
| Minimum | 77.8% | 82.9% |
| Maximum | 100.0% | 100.0% |
| Range | 22.2% | 17.1% |
| Mean | 91.2% | 94.3% |
| Median | 91.5% | 94.6% |
| Interquartile 25% (IQ1) | 89.4% | 92.8% |
| Interquartile 75% (IQ3) | 94.3% | 96.1% |
| Interquartile Range (IQR) | 5.0% | 3.3% |
| Standard Deviation (Sample) | 5.1% | 3.6% |
| Standard Deviation (Population) | 5.1% | 3.6% |
Similar Demographics by 11th Grade
Demographics Similar to Immigrants from Grenada by 11th Grade
In terms of 11th grade, the demographic groups most similar to Immigrants from Grenada are Native/Alaskan (90.2%, a difference of 0.050%), Immigrants from Vietnam (90.0%, a difference of 0.11%), Cuban (90.2%, a difference of 0.12%), Fijian (90.0%, a difference of 0.12%), and Haitian (90.3%, a difference of 0.14%).
| Demographics | Rating | Rank | 11th Grade |
| Apache | 0.0 /100 | #287 | Tragic 90.4% |
| Pennsylvania Germans | 0.0 /100 | #288 | Tragic 90.3% |
| British West Indians | 0.0 /100 | #289 | Tragic 90.3% |
| Indonesians | 0.0 /100 | #290 | Tragic 90.3% |
| Haitians | 0.0 /100 | #291 | Tragic 90.3% |
| Cubans | 0.0 /100 | #292 | Tragic 90.2% |
| Natives/Alaskans | 0.0 /100 | #293 | Tragic 90.2% |
| Immigrants | Grenada | 0.0 /100 | #294 | Tragic 90.1% |
| Immigrants | Vietnam | 0.0 /100 | #295 | Tragic 90.0% |
| Fijians | 0.0 /100 | #296 | Tragic 90.0% |
| Navajo | 0.0 /100 | #297 | Tragic 90.0% |
| Immigrants | Fiji | 0.0 /100 | #298 | Tragic 89.9% |
| Japanese | 0.0 /100 | #299 | Tragic 89.9% |
| Immigrants | Haiti | 0.0 /100 | #300 | Tragic 89.9% |
| Guyanese | 0.0 /100 | #301 | Tragic 89.9% |
Demographics Similar to Kenyans by 11th Grade
In terms of 11th grade, the demographic groups most similar to Kenyans are Ugandan (92.9%, a difference of 0.010%), Venezuelan (92.9%, a difference of 0.020%), Chilean (92.9%, a difference of 0.020%), Assyrian/Chaldean/Syriac (92.8%, a difference of 0.030%), and Crow (92.9%, a difference of 0.040%).
| Demographics | Rating | Rank | 11th Grade |
| Immigrants | Italy | 86.6 /100 | #135 | Excellent 92.9% |
| Cree | 85.9 /100 | #136 | Excellent 92.9% |
| Arabs | 85.4 /100 | #137 | Excellent 92.9% |
| Immigrants | Brazil | 85.1 /100 | #138 | Excellent 92.9% |
| Crow | 84.1 /100 | #139 | Excellent 92.9% |
| Venezuelans | 83.4 /100 | #140 | Excellent 92.9% |
| Chileans | 83.0 /100 | #141 | Excellent 92.9% |
| Kenyans | 82.0 /100 | #142 | Excellent 92.9% |
| Ugandans | 81.4 /100 | #143 | Excellent 92.9% |
| Assyrians/Chaldeans/Syriacs | 80.5 /100 | #144 | Excellent 92.8% |
| Pakistanis | 79.6 /100 | #145 | Good 92.8% |
| Iroquois | 79.1 /100 | #146 | Good 92.8% |
| Immigrants | Kenya | 78.7 /100 | #147 | Good 92.8% |
| Hmong | 78.6 /100 | #148 | Good 92.8% |
| Immigrants | Poland | 78.5 /100 | #149 | Good 92.8% |