Immigrants from Hungary vs Immigrants from Australia 8th Grade
COMPARE
Immigrants from Hungary
Immigrants from Australia
8th Grade
8th Grade Comparison
Immigrants from Hungary
Immigrants from Australia
96.1%
8TH GRADE
91.5/ 100
METRIC RATING
134th/ 347
METRIC RANK
96.5%
8TH GRADE
99.0/ 100
METRIC RATING
87th/ 347
METRIC RANK
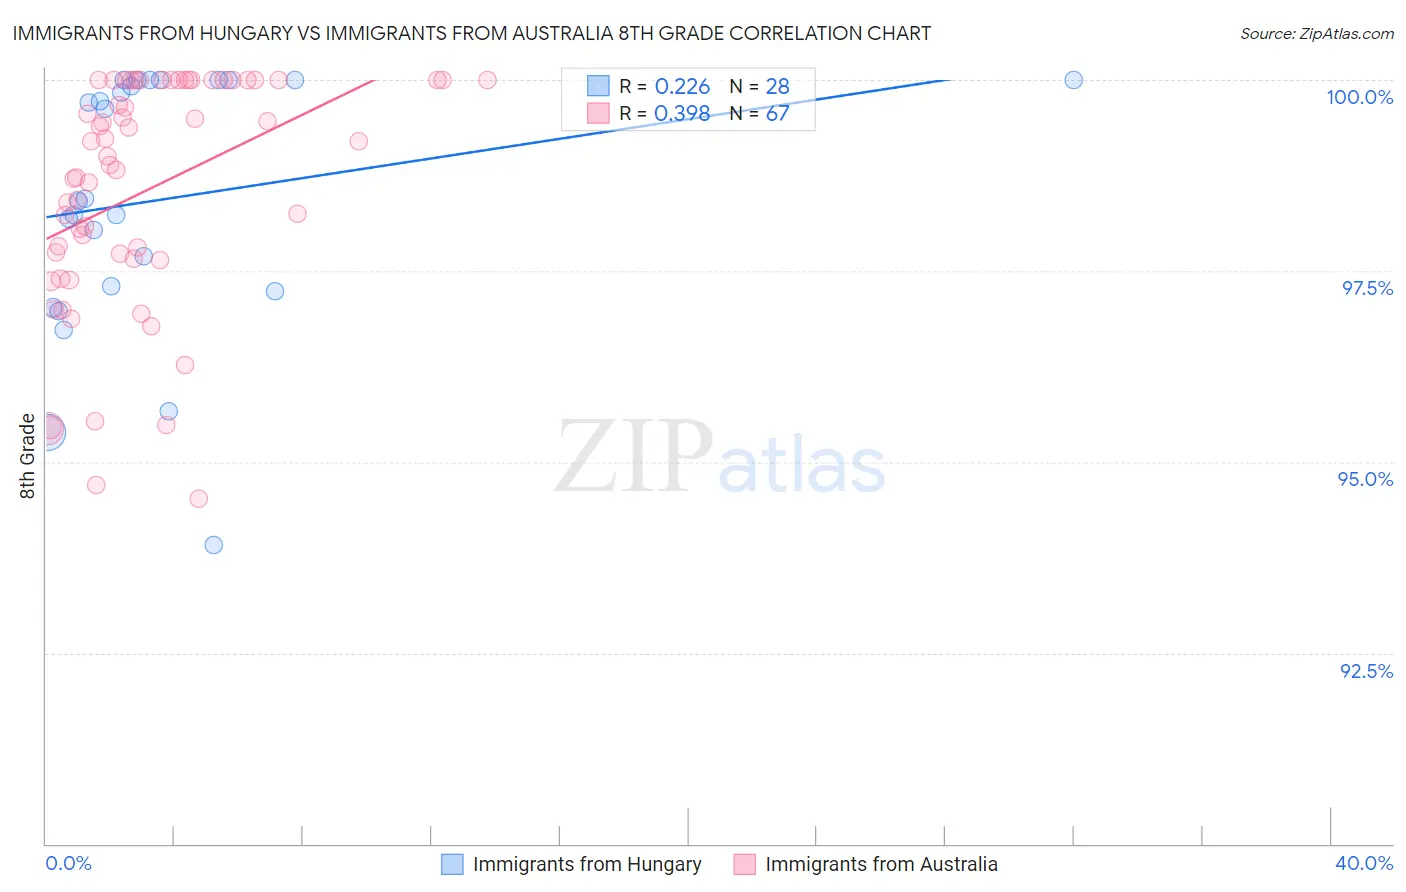
Immigrants from Hungary vs Immigrants from Australia 8th Grade Correlation Chart
The statistical analysis conducted on geographies consisting of 195,707,305 people shows a weak positive correlation between the proportion of Immigrants from Hungary and percentage of population with at least 8th grade education in the United States with a correlation coefficient (R) of 0.226 and weighted average of 96.1%. Similarly, the statistical analysis conducted on geographies consisting of 227,203,192 people shows a mild positive correlation between the proportion of Immigrants from Australia and percentage of population with at least 8th grade education in the United States with a correlation coefficient (R) of 0.398 and weighted average of 96.5%, a difference of 0.36%.
8th Grade Correlation Summary
| Measurement | Immigrants from Hungary | Immigrants from Australia |
| Minimum | 93.9% | 94.5% |
| Maximum | 100.0% | 100.0% |
| Range | 6.1% | 5.5% |
| Mean | 98.4% | 98.6% |
| Median | 98.4% | 99.0% |
| Interquartile 25% (IQ1) | 97.3% | 97.7% |
| Interquartile 75% (IQ3) | 100.0% | 100.0% |
| Interquartile Range (IQR) | 2.7% | 2.3% |
| Standard Deviation (Sample) | 1.7% | 1.5% |
| Standard Deviation (Population) | 1.7% | 1.5% |
Similar Demographics by 8th Grade
Demographics Similar to Immigrants from Hungary by 8th Grade
In terms of 8th grade, the demographic groups most similar to Immigrants from Hungary are Immigrants from Turkey (96.1%, a difference of 0.0%), Basque (96.1%, a difference of 0.0%), Jordanian (96.1%, a difference of 0.0%), Immigrants from Kuwait (96.1%, a difference of 0.010%), and Soviet Union (96.1%, a difference of 0.020%).
| Demographics | Rating | Rank | 8th Grade |
| Immigrants | Serbia | 94.0 /100 | #127 | Exceptional 96.2% |
| Immigrants | Bosnia and Herzegovina | 93.9 /100 | #128 | Exceptional 96.2% |
| Cheyenne | 93.3 /100 | #129 | Exceptional 96.1% |
| Soviet Union | 92.6 /100 | #130 | Exceptional 96.1% |
| Pueblo | 92.3 /100 | #131 | Exceptional 96.1% |
| Immigrants | Kuwait | 92.2 /100 | #132 | Exceptional 96.1% |
| Immigrants | Turkey | 91.7 /100 | #133 | Exceptional 96.1% |
| Immigrants | Hungary | 91.5 /100 | #134 | Exceptional 96.1% |
| Basques | 91.5 /100 | #135 | Exceptional 96.1% |
| Jordanians | 91.3 /100 | #136 | Exceptional 96.1% |
| Cambodians | 90.6 /100 | #137 | Exceptional 96.1% |
| Burmese | 90.2 /100 | #138 | Exceptional 96.1% |
| Hmong | 89.7 /100 | #139 | Excellent 96.1% |
| Immigrants | South Central Asia | 89.4 /100 | #140 | Excellent 96.1% |
| Immigrants | Greece | 85.9 /100 | #141 | Excellent 96.0% |
Demographics Similar to Immigrants from Australia by 8th Grade
In terms of 8th grade, the demographic groups most similar to Immigrants from Australia are Immigrants from South Africa (96.5%, a difference of 0.0%), Cherokee (96.5%, a difference of 0.0%), Immigrants from Western Europe (96.4%, a difference of 0.010%), Immigrants from Belgium (96.5%, a difference of 0.020%), and Chickasaw (96.4%, a difference of 0.020%).
| Demographics | Rating | Rank | 8th Grade |
| Delaware | 99.2 /100 | #80 | Exceptional 96.5% |
| Romanians | 99.2 /100 | #81 | Exceptional 96.5% |
| Turks | 99.2 /100 | #82 | Exceptional 96.5% |
| Icelanders | 99.2 /100 | #83 | Exceptional 96.5% |
| Immigrants | Belgium | 99.1 /100 | #84 | Exceptional 96.5% |
| Immigrants | South Africa | 99.1 /100 | #85 | Exceptional 96.5% |
| Cherokee | 99.0 /100 | #86 | Exceptional 96.5% |
| Immigrants | Australia | 99.0 /100 | #87 | Exceptional 96.5% |
| Immigrants | Western Europe | 99.0 /100 | #88 | Exceptional 96.4% |
| Chickasaw | 98.9 /100 | #89 | Exceptional 96.4% |
| Immigrants | Sweden | 98.9 /100 | #90 | Exceptional 96.4% |
| Thais | 98.9 /100 | #91 | Exceptional 96.4% |
| Menominee | 98.9 /100 | #92 | Exceptional 96.4% |
| Immigrants | Denmark | 98.8 /100 | #93 | Exceptional 96.4% |
| Immigrants | Singapore | 98.8 /100 | #94 | Exceptional 96.4% |