Immigrants from Korea vs Immigrants from Guatemala 4th Grade
COMPARE
Immigrants from Korea
Immigrants from Guatemala
4th Grade
4th Grade Comparison
Immigrants from Korea
Immigrants from Guatemala
97.5%
4TH GRADE
50.6/ 100
METRIC RATING
173rd/ 347
METRIC RANK
95.1%
4TH GRADE
0.0/ 100
METRIC RATING
343rd/ 347
METRIC RANK
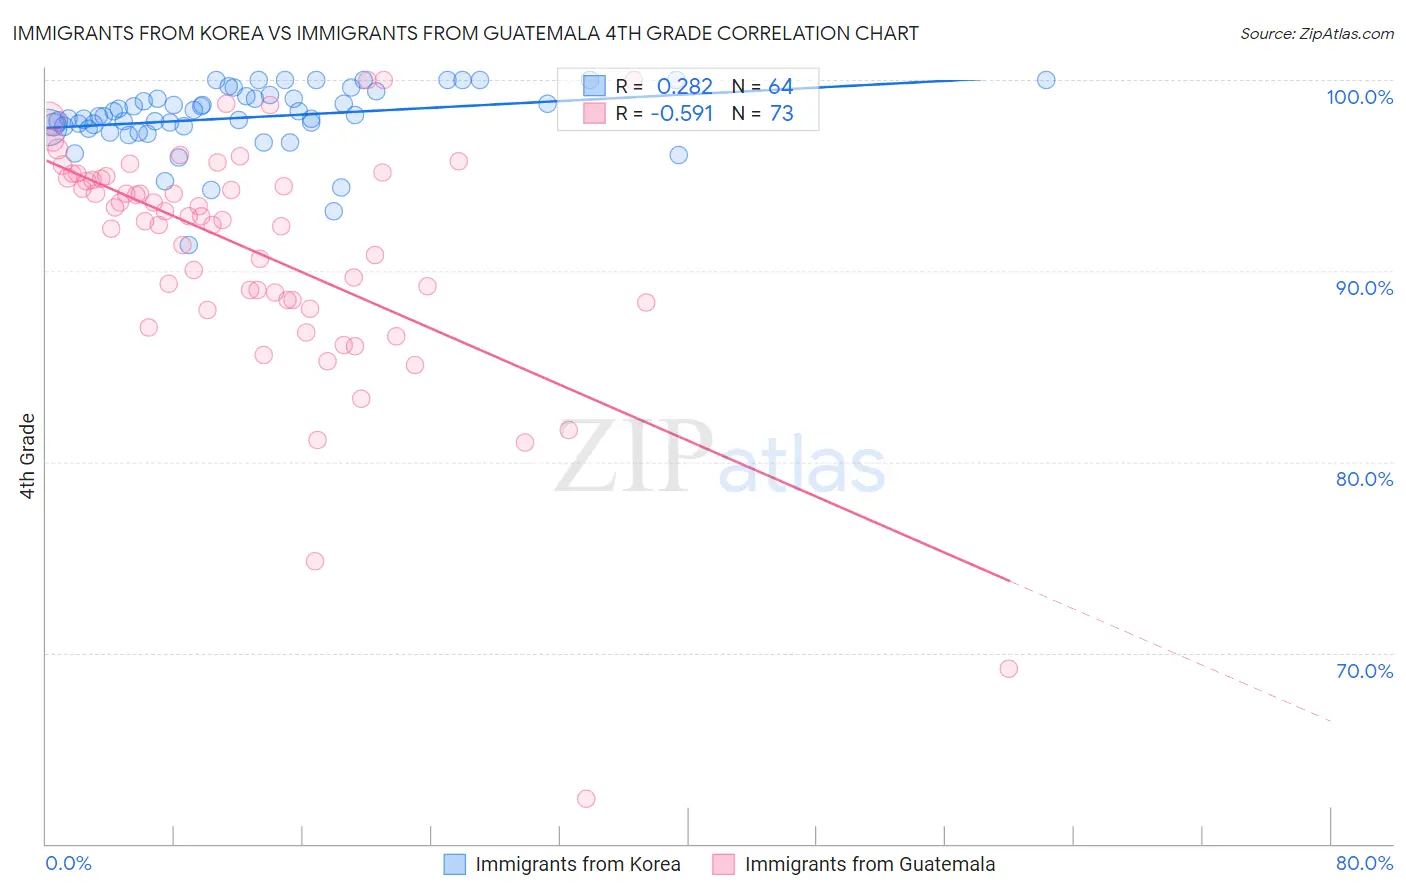
Immigrants from Korea vs Immigrants from Guatemala 4th Grade Correlation Chart
The statistical analysis conducted on geographies consisting of 416,280,076 people shows a weak positive correlation between the proportion of Immigrants from Korea and percentage of population with at least 4th grade education in the United States with a correlation coefficient (R) of 0.282 and weighted average of 97.5%. Similarly, the statistical analysis conducted on geographies consisting of 377,285,993 people shows a substantial negative correlation between the proportion of Immigrants from Guatemala and percentage of population with at least 4th grade education in the United States with a correlation coefficient (R) of -0.591 and weighted average of 95.1%, a difference of 2.6%.
4th Grade Correlation Summary
| Measurement | Immigrants from Korea | Immigrants from Guatemala |
| Minimum | 91.3% | 62.4% |
| Maximum | 100.0% | 100.0% |
| Range | 8.7% | 37.6% |
| Mean | 98.0% | 91.0% |
| Median | 98.1% | 92.9% |
| Interquartile 25% (IQ1) | 97.6% | 88.4% |
| Interquartile 75% (IQ3) | 99.2% | 94.9% |
| Interquartile Range (IQR) | 1.6% | 6.5% |
| Standard Deviation (Sample) | 1.7% | 6.5% |
| Standard Deviation (Population) | 1.7% | 6.4% |
Similar Demographics by 4th Grade
Demographics Similar to Immigrants from Korea by 4th Grade
In terms of 4th grade, the demographic groups most similar to Immigrants from Korea are Immigrants from Spain (97.5%, a difference of 0.0%), Brazilian (97.5%, a difference of 0.0%), Immigrants from Sri Lanka (97.5%, a difference of 0.0%), Egyptian (97.5%, a difference of 0.0%), and Immigrants from Micronesia (97.5%, a difference of 0.0%).
| Demographics | Rating | Rank | 4th Grade |
| Kenyans | 56.5 /100 | #166 | Average 97.5% |
| Immigrants | Poland | 55.9 /100 | #167 | Average 97.5% |
| Immigrants | Belarus | 55.8 /100 | #168 | Average 97.5% |
| Chileans | 54.4 /100 | #169 | Average 97.5% |
| Immigrants | Spain | 51.8 /100 | #170 | Average 97.5% |
| Brazilians | 51.5 /100 | #171 | Average 97.5% |
| Immigrants | Sri Lanka | 51.1 /100 | #172 | Average 97.5% |
| Immigrants | Korea | 50.6 /100 | #173 | Average 97.5% |
| Egyptians | 50.0 /100 | #174 | Average 97.5% |
| Immigrants | Micronesia | 49.6 /100 | #175 | Average 97.5% |
| Arabs | 48.7 /100 | #176 | Average 97.5% |
| Immigrants | Brazil | 46.1 /100 | #177 | Average 97.5% |
| Comanche | 45.3 /100 | #178 | Average 97.5% |
| Immigrants | Kazakhstan | 43.6 /100 | #179 | Average 97.5% |
| Immigrants | Venezuela | 42.7 /100 | #180 | Average 97.5% |
Demographics Similar to Immigrants from Guatemala by 4th Grade
In terms of 4th grade, the demographic groups most similar to Immigrants from Guatemala are Immigrants from Central America (95.1%, a difference of 0.030%), Immigrants from Mexico (95.1%, a difference of 0.030%), Salvadoran (95.0%, a difference of 0.040%), Immigrants from Yemen (95.2%, a difference of 0.11%), and Yakama (95.2%, a difference of 0.12%).
| Demographics | Rating | Rank | 4th Grade |
| Immigrants | Dominican Republic | 0.0 /100 | #333 | Tragic 95.7% |
| Immigrants | Cabo Verde | 0.0 /100 | #334 | Tragic 95.7% |
| Immigrants | Latin America | 0.0 /100 | #335 | Tragic 95.7% |
| Mexicans | 0.0 /100 | #336 | Tragic 95.6% |
| Central Americans | 0.0 /100 | #337 | Tragic 95.5% |
| Nepalese | 0.0 /100 | #338 | Tragic 95.5% |
| Guatemalans | 0.0 /100 | #339 | Tragic 95.3% |
| Yakama | 0.0 /100 | #340 | Tragic 95.2% |
| Immigrants | Yemen | 0.0 /100 | #341 | Tragic 95.2% |
| Immigrants | Central America | 0.0 /100 | #342 | Tragic 95.1% |
| Immigrants | Guatemala | 0.0 /100 | #343 | Tragic 95.1% |
| Immigrants | Mexico | 0.0 /100 | #344 | Tragic 95.1% |
| Salvadorans | 0.0 /100 | #345 | Tragic 95.0% |
| Immigrants | El Salvador | 0.0 /100 | #346 | Tragic 94.8% |
| Spanish American Indians | 0.0 /100 | #347 | Tragic 94.6% |