Immigrants from Middle Africa vs Immigrants from Armenia 8th Grade
COMPARE
Immigrants from Middle Africa
Immigrants from Armenia
8th Grade
8th Grade Comparison
Immigrants from Middle Africa
Immigrants from Armenia
95.1%
8TH GRADE
1.7/ 100
METRIC RATING
244th/ 347
METRIC RANK
92.3%
8TH GRADE
0.0/ 100
METRIC RATING
330th/ 347
METRIC RANK
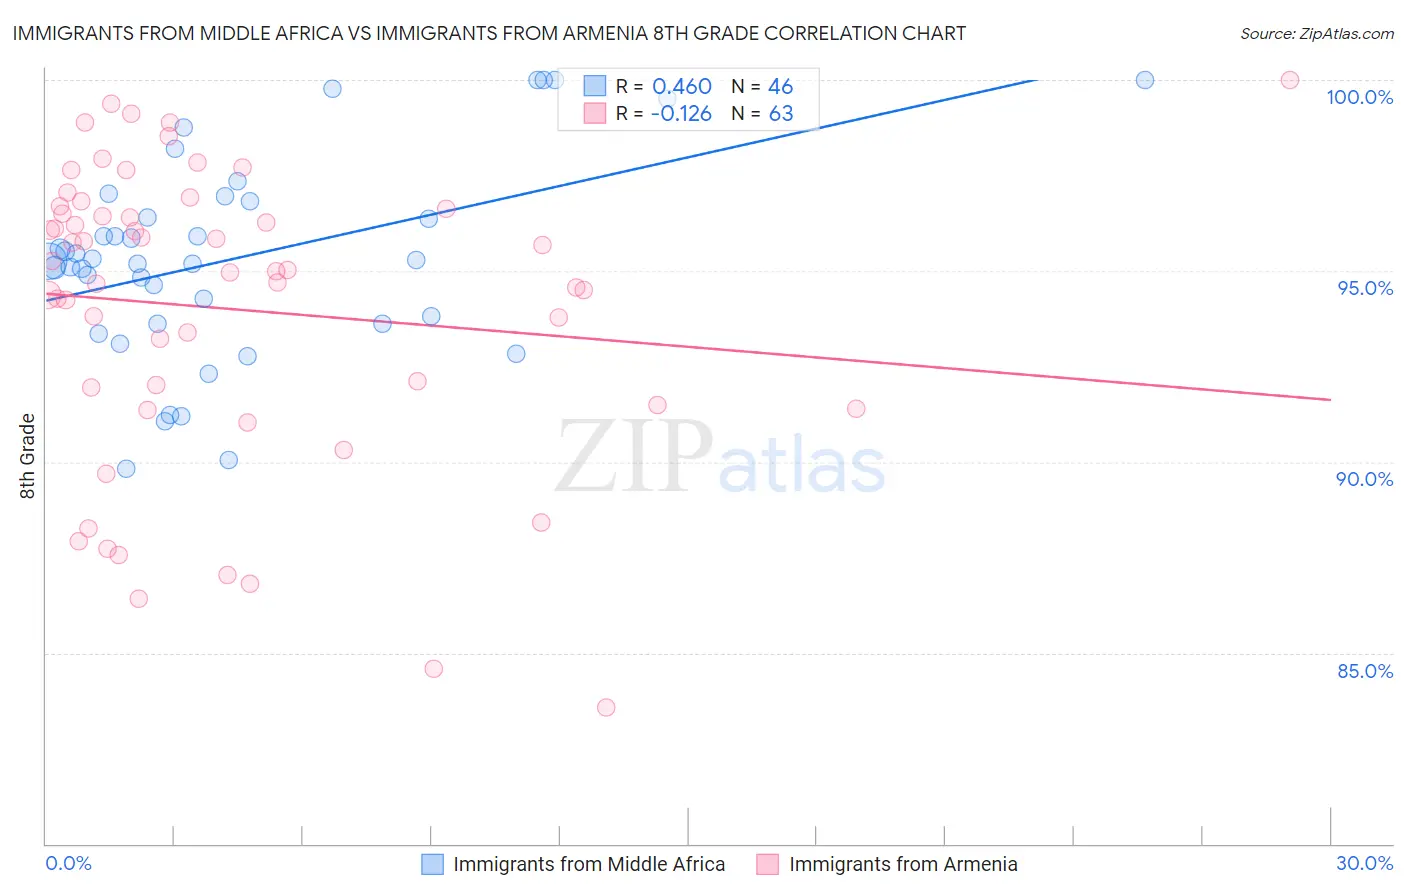
Immigrants from Middle Africa vs Immigrants from Armenia 8th Grade Correlation Chart
The statistical analysis conducted on geographies consisting of 202,699,867 people shows a moderate positive correlation between the proportion of Immigrants from Middle Africa and percentage of population with at least 8th grade education in the United States with a correlation coefficient (R) of 0.460 and weighted average of 95.1%. Similarly, the statistical analysis conducted on geographies consisting of 97,657,339 people shows a poor negative correlation between the proportion of Immigrants from Armenia and percentage of population with at least 8th grade education in the United States with a correlation coefficient (R) of -0.126 and weighted average of 92.3%, a difference of 3.0%.
8th Grade Correlation Summary
| Measurement | Immigrants from Middle Africa | Immigrants from Armenia |
| Minimum | 89.8% | 83.6% |
| Maximum | 100.0% | 100.0% |
| Range | 10.2% | 16.4% |
| Mean | 95.4% | 94.0% |
| Median | 95.3% | 95.0% |
| Interquartile 25% (IQ1) | 93.6% | 91.5% |
| Interquartile 75% (IQ3) | 96.8% | 96.6% |
| Interquartile Range (IQR) | 3.2% | 5.1% |
| Standard Deviation (Sample) | 2.6% | 3.9% |
| Standard Deviation (Population) | 2.6% | 3.9% |
Similar Demographics by 8th Grade
Demographics Similar to Immigrants from Middle Africa by 8th Grade
In terms of 8th grade, the demographic groups most similar to Immigrants from Middle Africa are Tongan (95.1%, a difference of 0.0%), Paiute (95.1%, a difference of 0.0%), South American Indian (95.1%, a difference of 0.020%), Immigrants from Sierra Leone (95.1%, a difference of 0.030%), and Ethiopian (95.1%, a difference of 0.030%).
| Demographics | Rating | Rank | 8th Grade |
| Immigrants | Africa | 2.7 /100 | #237 | Tragic 95.2% |
| Natives/Alaskans | 2.3 /100 | #238 | Tragic 95.2% |
| Immigrants | Sierra Leone | 2.1 /100 | #239 | Tragic 95.1% |
| Ethiopians | 2.0 /100 | #240 | Tragic 95.1% |
| South American Indians | 1.9 /100 | #241 | Tragic 95.1% |
| Tongans | 1.7 /100 | #242 | Tragic 95.1% |
| Paiute | 1.7 /100 | #243 | Tragic 95.1% |
| Immigrants | Middle Africa | 1.7 /100 | #244 | Tragic 95.1% |
| Jamaicans | 1.4 /100 | #245 | Tragic 95.1% |
| Somalis | 1.4 /100 | #246 | Tragic 95.1% |
| Immigrants | Senegal | 1.4 /100 | #247 | Tragic 95.1% |
| Uruguayans | 1.2 /100 | #248 | Tragic 95.1% |
| Immigrants | China | 1.1 /100 | #249 | Tragic 95.0% |
| Koreans | 1.1 /100 | #250 | Tragic 95.0% |
| Bolivians | 1.0 /100 | #251 | Tragic 95.0% |
Demographics Similar to Immigrants from Armenia by 8th Grade
In terms of 8th grade, the demographic groups most similar to Immigrants from Armenia are Honduran (92.3%, a difference of 0.010%), Immigrants from Dominican Republic (92.3%, a difference of 0.020%), Immigrants from Cabo Verde (92.4%, a difference of 0.090%), Hispanic or Latino (92.2%, a difference of 0.14%), and Immigrants from Nicaragua (92.5%, a difference of 0.15%).
| Demographics | Rating | Rank | 8th Grade |
| Immigrants | Belize | 0.0 /100 | #323 | Tragic 92.9% |
| Nepalese | 0.0 /100 | #324 | Tragic 92.8% |
| Dominicans | 0.0 /100 | #325 | Tragic 92.8% |
| Central American Indians | 0.0 /100 | #326 | Tragic 92.7% |
| Immigrants | Azores | 0.0 /100 | #327 | Tragic 92.5% |
| Immigrants | Nicaragua | 0.0 /100 | #328 | Tragic 92.5% |
| Immigrants | Cabo Verde | 0.0 /100 | #329 | Tragic 92.4% |
| Immigrants | Armenia | 0.0 /100 | #330 | Tragic 92.3% |
| Hondurans | 0.0 /100 | #331 | Tragic 92.3% |
| Immigrants | Dominican Republic | 0.0 /100 | #332 | Tragic 92.3% |
| Hispanics or Latinos | 0.0 /100 | #333 | Tragic 92.2% |
| Immigrants | Yemen | 0.0 /100 | #334 | Tragic 92.1% |
| Mexican American Indians | 0.0 /100 | #335 | Tragic 92.1% |
| Immigrants | Honduras | 0.0 /100 | #336 | Tragic 91.9% |
| Immigrants | Latin America | 0.0 /100 | #337 | Tragic 91.7% |