Immigrants from North America vs Immigrants from Indonesia 12th Grade, No Diploma
COMPARE
Immigrants from North America
Immigrants from Indonesia
12th Grade, No Diploma
12th Grade, No Diploma Comparison
Immigrants from North America
Immigrants from Indonesia
92.8%
12TH GRADE, NO DIPLOMA
99.7/ 100
METRIC RATING
59th/ 347
METRIC RANK
91.2%
12TH GRADE, NO DIPLOMA
54.9/ 100
METRIC RATING
169th/ 347
METRIC RANK
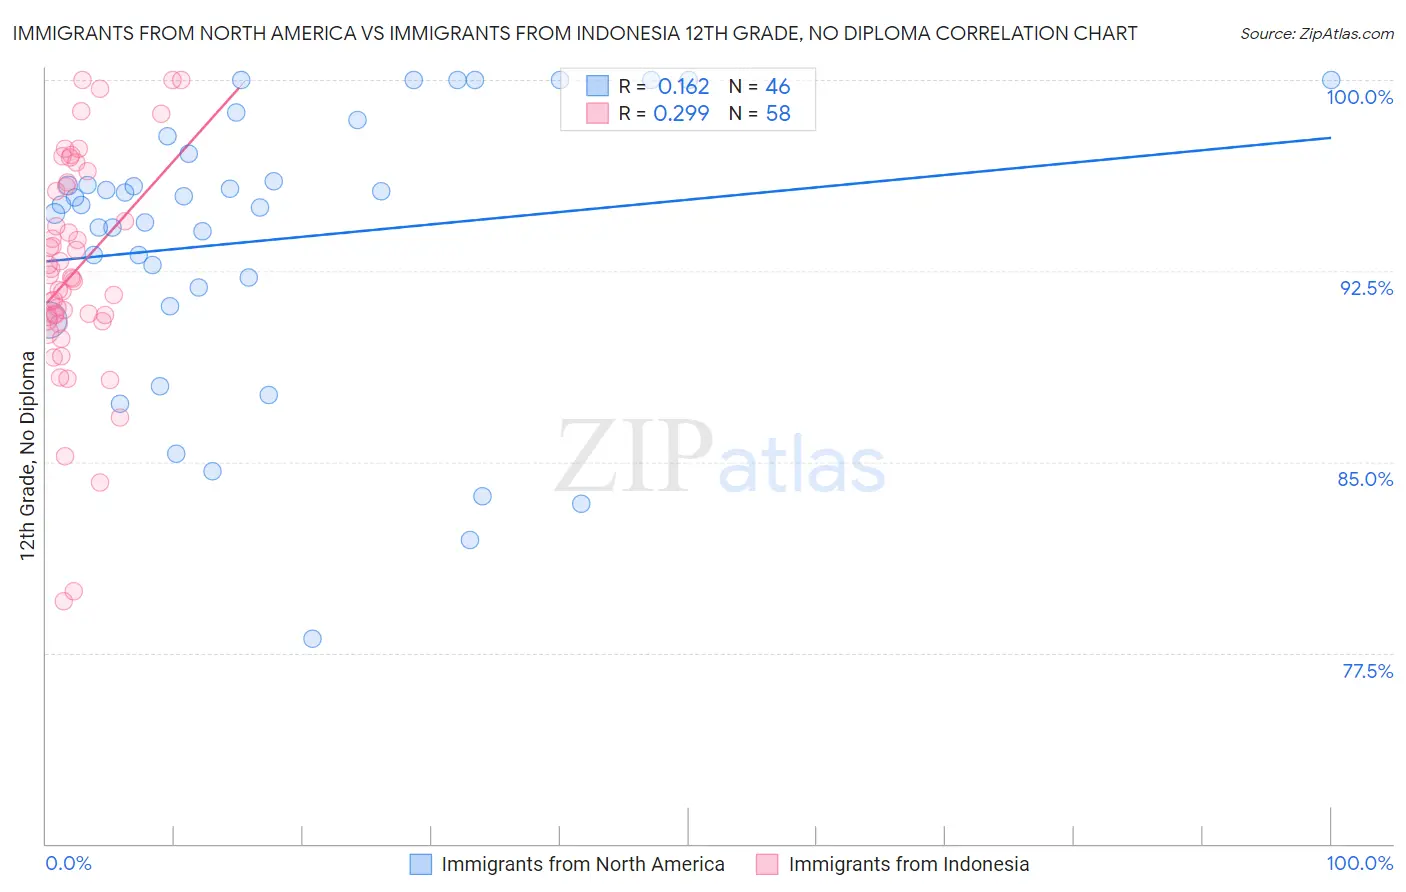
Immigrants from North America vs Immigrants from Indonesia 12th Grade, No Diploma Correlation Chart
The statistical analysis conducted on geographies consisting of 462,461,913 people shows a poor positive correlation between the proportion of Immigrants from North America and percentage of population with at least 12th grade (no diploma) education in the United States with a correlation coefficient (R) of 0.162 and weighted average of 92.8%. Similarly, the statistical analysis conducted on geographies consisting of 215,765,946 people shows a weak positive correlation between the proportion of Immigrants from Indonesia and percentage of population with at least 12th grade (no diploma) education in the United States with a correlation coefficient (R) of 0.299 and weighted average of 91.2%, a difference of 1.7%.
12th Grade, No Diploma Correlation Summary
| Measurement | Immigrants from North America | Immigrants from Indonesia |
| Minimum | 78.1% | 79.5% |
| Maximum | 100.0% | 100.0% |
| Range | 21.9% | 20.5% |
| Mean | 93.7% | 92.5% |
| Median | 95.1% | 92.2% |
| Interquartile 25% (IQ1) | 91.9% | 90.6% |
| Interquartile 75% (IQ3) | 97.1% | 95.8% |
| Interquartile Range (IQR) | 5.2% | 5.3% |
| Standard Deviation (Sample) | 5.4% | 4.4% |
| Standard Deviation (Population) | 5.4% | 4.3% |
Similar Demographics by 12th Grade, No Diploma
Demographics Similar to Immigrants from North America by 12th Grade, No Diploma
In terms of 12th grade, no diploma, the demographic groups most similar to Immigrants from North America are Slavic (92.8%, a difference of 0.0%), Immigrants from Taiwan (92.8%, a difference of 0.010%), Immigrants from Japan (92.8%, a difference of 0.020%), Immigrants from Canada (92.8%, a difference of 0.030%), and Ukrainian (92.7%, a difference of 0.040%).
| Demographics | Rating | Rank | 12th Grade, No Diploma |
| Immigrants | Sweden | 99.8 /100 | #52 | Exceptional 92.8% |
| Serbians | 99.7 /100 | #53 | Exceptional 92.8% |
| Hungarians | 99.7 /100 | #54 | Exceptional 92.8% |
| Welsh | 99.7 /100 | #55 | Exceptional 92.8% |
| New Zealanders | 99.7 /100 | #56 | Exceptional 92.8% |
| Immigrants | Canada | 99.7 /100 | #57 | Exceptional 92.8% |
| Immigrants | Taiwan | 99.7 /100 | #58 | Exceptional 92.8% |
| Immigrants | North America | 99.7 /100 | #59 | Exceptional 92.8% |
| Slavs | 99.7 /100 | #60 | Exceptional 92.8% |
| Immigrants | Japan | 99.7 /100 | #61 | Exceptional 92.8% |
| Ukrainians | 99.6 /100 | #62 | Exceptional 92.7% |
| Zimbabweans | 99.6 /100 | #63 | Exceptional 92.7% |
| Immigrants | Netherlands | 99.6 /100 | #64 | Exceptional 92.7% |
| Austrians | 99.6 /100 | #65 | Exceptional 92.7% |
| Soviet Union | 99.6 /100 | #66 | Exceptional 92.7% |
Demographics Similar to Immigrants from Indonesia by 12th Grade, No Diploma
In terms of 12th grade, no diploma, the demographic groups most similar to Immigrants from Indonesia are Cree (91.2%, a difference of 0.030%), Delaware (91.2%, a difference of 0.030%), Alsatian (91.3%, a difference of 0.040%), Hmong (91.3%, a difference of 0.040%), and Immigrants from Malaysia (91.3%, a difference of 0.040%).
| Demographics | Rating | Rank | 12th Grade, No Diploma |
| Brazilians | 62.0 /100 | #162 | Good 91.3% |
| Immigrants | Asia | 61.5 /100 | #163 | Good 91.3% |
| Immigrants | China | 60.9 /100 | #164 | Good 91.3% |
| Alsatians | 58.3 /100 | #165 | Average 91.3% |
| Hmong | 58.0 /100 | #166 | Average 91.3% |
| Immigrants | Malaysia | 57.8 /100 | #167 | Average 91.3% |
| Cree | 57.0 /100 | #168 | Average 91.2% |
| Immigrants | Indonesia | 54.9 /100 | #169 | Average 91.2% |
| Delaware | 52.8 /100 | #170 | Average 91.2% |
| Immigrants | Morocco | 51.4 /100 | #171 | Average 91.2% |
| Bermudans | 50.8 /100 | #172 | Average 91.2% |
| Bolivians | 50.4 /100 | #173 | Average 91.2% |
| Immigrants | Nepal | 50.0 /100 | #174 | Average 91.2% |
| Immigrants | Western Asia | 49.0 /100 | #175 | Average 91.2% |
| Iroquois | 48.5 /100 | #176 | Average 91.1% |