Immigrants from North Macedonia vs British 2nd Grade
COMPARE
Immigrants from North Macedonia
British
2nd Grade
2nd Grade Comparison
Immigrants from North Macedonia
British
97.9%
2ND GRADE
68.5/ 100
METRIC RATING
152nd/ 347
METRIC RANK
98.5%
2ND GRADE
100.0/ 100
METRIC RATING
36th/ 347
METRIC RANK
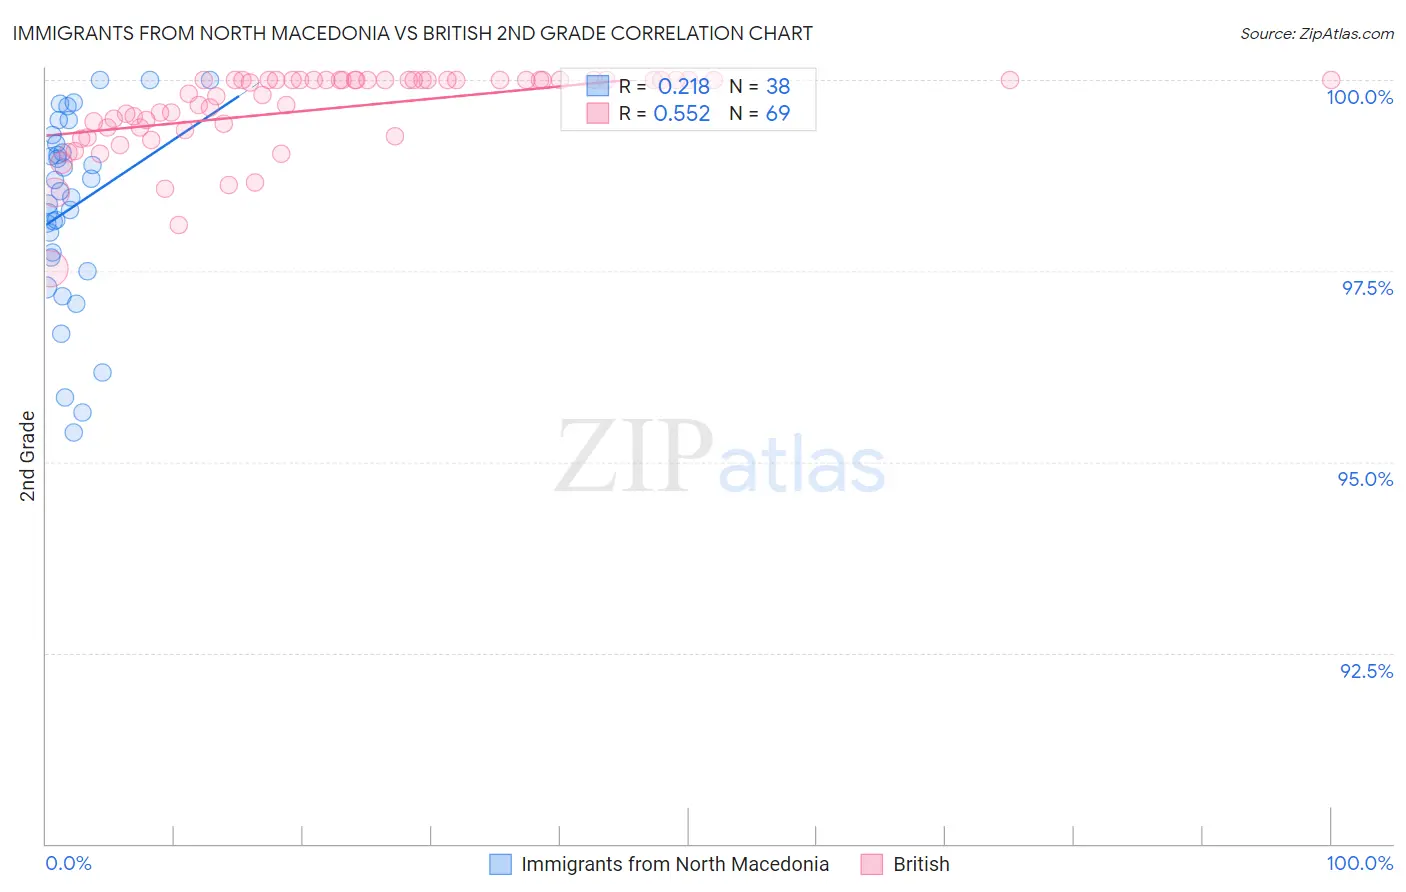
Immigrants from North Macedonia vs British 2nd Grade Correlation Chart
The statistical analysis conducted on geographies consisting of 74,317,186 people shows a weak positive correlation between the proportion of Immigrants from North Macedonia and percentage of population with at least 2nd grade education in the United States with a correlation coefficient (R) of 0.218 and weighted average of 97.9%. Similarly, the statistical analysis conducted on geographies consisting of 531,462,526 people shows a substantial positive correlation between the proportion of British and percentage of population with at least 2nd grade education in the United States with a correlation coefficient (R) of 0.552 and weighted average of 98.5%, a difference of 0.55%.
2nd Grade Correlation Summary
| Measurement | Immigrants from North Macedonia | British |
| Minimum | 95.4% | 97.5% |
| Maximum | 100.0% | 100.0% |
| Range | 4.6% | 2.5% |
| Mean | 98.3% | 99.6% |
| Median | 98.5% | 100.0% |
| Interquartile 25% (IQ1) | 97.7% | 99.4% |
| Interquartile 75% (IQ3) | 99.2% | 100.0% |
| Interquartile Range (IQR) | 1.5% | 0.64% |
| Standard Deviation (Sample) | 1.2% | 0.53% |
| Standard Deviation (Population) | 1.2% | 0.53% |
Similar Demographics by 2nd Grade
Demographics Similar to Immigrants from North Macedonia by 2nd Grade
In terms of 2nd grade, the demographic groups most similar to Immigrants from North Macedonia are Immigrants from South Central Asia (97.9%, a difference of 0.0%), Marshallese (97.9%, a difference of 0.0%), Soviet Union (97.9%, a difference of 0.010%), French American Indian (97.9%, a difference of 0.010%), and Jordanian (98.0%, a difference of 0.020%).
| Demographics | Rating | Rank | 2nd Grade |
| Filipinos | 79.2 /100 | #145 | Good 98.0% |
| Immigrants | Israel | 78.0 /100 | #146 | Good 98.0% |
| Immigrants | Greece | 76.8 /100 | #147 | Good 98.0% |
| Jordanians | 74.5 /100 | #148 | Good 98.0% |
| Apache | 74.0 /100 | #149 | Good 97.9% |
| Immigrants | Moldova | 72.9 /100 | #150 | Good 97.9% |
| Soviet Union | 70.7 /100 | #151 | Good 97.9% |
| Immigrants | North Macedonia | 68.5 /100 | #152 | Good 97.9% |
| Immigrants | South Central Asia | 68.3 /100 | #153 | Good 97.9% |
| Marshallese | 67.7 /100 | #154 | Good 97.9% |
| French American Indians | 64.3 /100 | #155 | Good 97.9% |
| Dutch West Indians | 63.8 /100 | #156 | Good 97.9% |
| Venezuelans | 63.3 /100 | #157 | Good 97.9% |
| Immigrants | Iran | 62.8 /100 | #158 | Good 97.9% |
| Comanche | 62.8 /100 | #159 | Good 97.9% |
Demographics Similar to British by 2nd Grade
In terms of 2nd grade, the demographic groups most similar to British are Chinese (98.5%, a difference of 0.020%), Swiss (98.5%, a difference of 0.020%), Italian (98.4%, a difference of 0.020%), Latvian (98.4%, a difference of 0.030%), and Chippewa (98.4%, a difference of 0.030%).
| Demographics | Rating | Rank | 2nd Grade |
| French | 100.0 /100 | #29 | Exceptional 98.5% |
| Europeans | 100.0 /100 | #30 | Exceptional 98.5% |
| Czechs | 100.0 /100 | #31 | Exceptional 98.5% |
| French Canadians | 100.0 /100 | #32 | Exceptional 98.5% |
| Scandinavians | 100.0 /100 | #33 | Exceptional 98.5% |
| Chinese | 100.0 /100 | #34 | Exceptional 98.5% |
| Swiss | 100.0 /100 | #35 | Exceptional 98.5% |
| British | 100.0 /100 | #36 | Exceptional 98.5% |
| Italians | 99.9 /100 | #37 | Exceptional 98.4% |
| Latvians | 99.9 /100 | #38 | Exceptional 98.4% |
| Chippewa | 99.9 /100 | #39 | Exceptional 98.4% |
| Luxembourgers | 99.9 /100 | #40 | Exceptional 98.4% |
| Eastern Europeans | 99.9 /100 | #41 | Exceptional 98.4% |
| Native Hawaiians | 99.9 /100 | #42 | Exceptional 98.4% |
| Belgians | 99.9 /100 | #43 | Exceptional 98.4% |