Immigrants from North Macedonia vs French American Indian 7th Grade
COMPARE
Immigrants from North Macedonia
French American Indian
7th Grade
7th Grade Comparison
Immigrants from North Macedonia
French American Indians
96.4%
7TH GRADE
93.1/ 100
METRIC RATING
129th/ 347
METRIC RANK
96.3%
7TH GRADE
83.1/ 100
METRIC RATING
147th/ 347
METRIC RANK
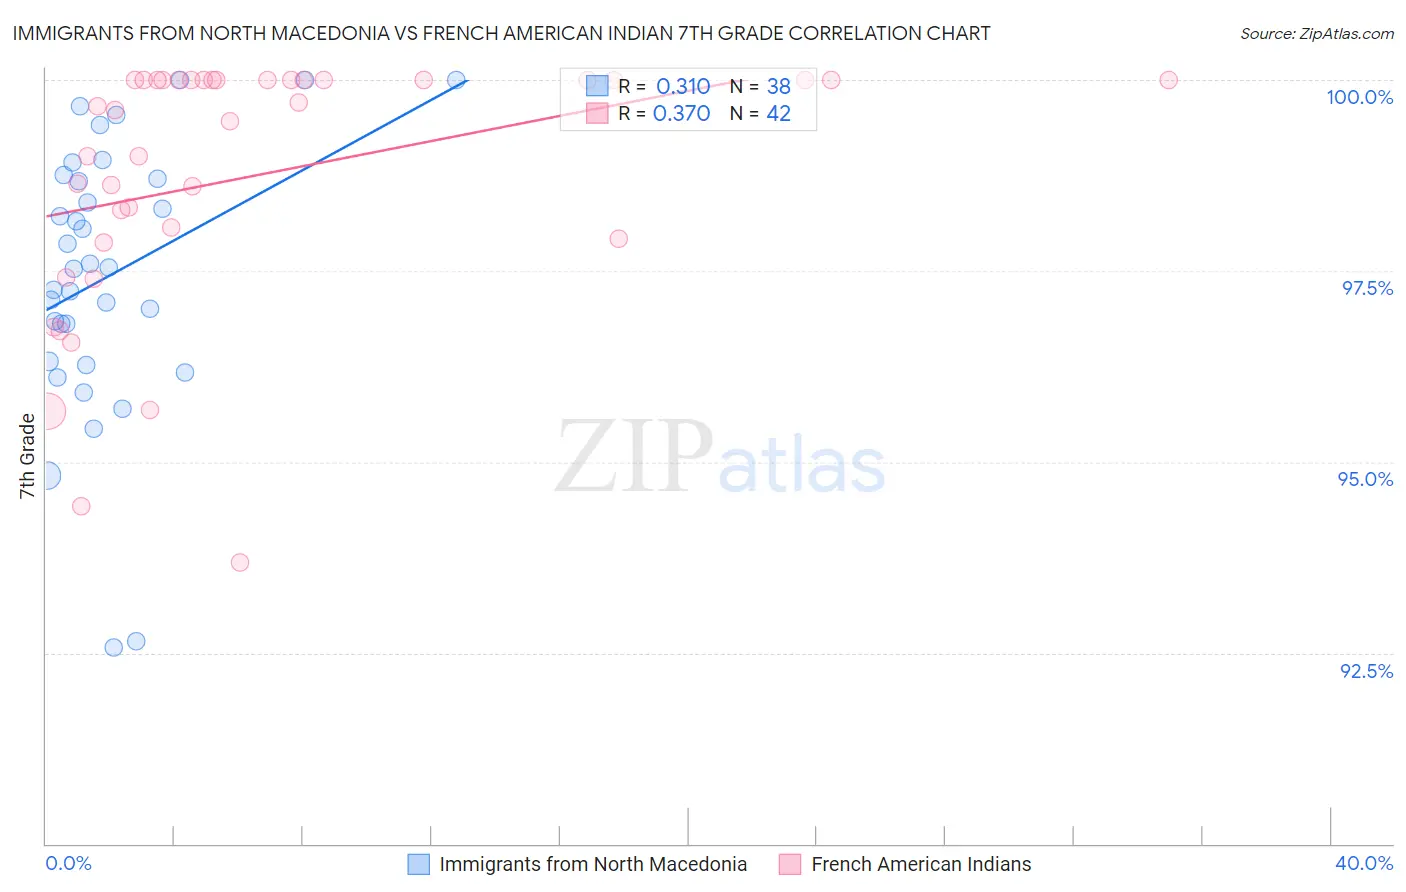
Immigrants from North Macedonia vs French American Indian 7th Grade Correlation Chart
The statistical analysis conducted on geographies consisting of 74,317,186 people shows a mild positive correlation between the proportion of Immigrants from North Macedonia and percentage of population with at least 7th grade education in the United States with a correlation coefficient (R) of 0.310 and weighted average of 96.4%. Similarly, the statistical analysis conducted on geographies consisting of 131,974,096 people shows a mild positive correlation between the proportion of French American Indians and percentage of population with at least 7th grade education in the United States with a correlation coefficient (R) of 0.370 and weighted average of 96.3%, a difference of 0.15%.
7th Grade Correlation Summary
| Measurement | Immigrants from North Macedonia | French American Indian |
| Minimum | 92.6% | 93.7% |
| Maximum | 100.0% | 100.0% |
| Range | 7.4% | 6.3% |
| Mean | 97.4% | 98.7% |
| Median | 97.5% | 99.6% |
| Interquartile 25% (IQ1) | 96.3% | 97.9% |
| Interquartile 75% (IQ3) | 98.7% | 100.0% |
| Interquartile Range (IQR) | 2.4% | 2.1% |
| Standard Deviation (Sample) | 1.8% | 1.7% |
| Standard Deviation (Population) | 1.7% | 1.7% |
Demographics Similar to Immigrants from North Macedonia and French American Indians by 7th Grade
In terms of 7th grade, the demographic groups most similar to Immigrants from North Macedonia are Immigrants from Romania (96.4%, a difference of 0.0%), Immigrants from Serbia (96.4%, a difference of 0.010%), Filipino (96.4%, a difference of 0.020%), Colville (96.4%, a difference of 0.030%), and Hmong (96.4%, a difference of 0.040%). Similarly, the demographic groups most similar to French American Indians are Israeli (96.3%, a difference of 0.0%), Blackfeet (96.3%, a difference of 0.010%), Immigrants from Eastern Europe (96.3%, a difference of 0.010%), Immigrants from Greece (96.3%, a difference of 0.030%), and Spanish (96.3%, a difference of 0.040%).
| Demographics | Rating | Rank | 7th Grade |
| Immigrants | Romania | 93.2 /100 | #128 | Exceptional 96.4% |
| Immigrants | North Macedonia | 93.1 /100 | #129 | Exceptional 96.4% |
| Immigrants | Serbia | 92.8 /100 | #130 | Exceptional 96.4% |
| Filipinos | 92.1 /100 | #131 | Exceptional 96.4% |
| Colville | 91.7 /100 | #132 | Exceptional 96.4% |
| Hmong | 91.5 /100 | #133 | Exceptional 96.4% |
| Soviet Union | 91.2 /100 | #134 | Exceptional 96.4% |
| Immigrants | Kuwait | 91.1 /100 | #135 | Exceptional 96.4% |
| Immigrants | Hungary | 90.6 /100 | #136 | Exceptional 96.4% |
| Immigrants | Turkey | 90.2 /100 | #137 | Exceptional 96.4% |
| Jordanians | 90.0 /100 | #138 | Excellent 96.4% |
| Basques | 89.3 /100 | #139 | Excellent 96.4% |
| Cambodians | 88.3 /100 | #140 | Excellent 96.3% |
| Immigrants | South Central Asia | 87.1 /100 | #141 | Excellent 96.3% |
| Burmese | 87.1 /100 | #142 | Excellent 96.3% |
| Spanish | 86.6 /100 | #143 | Excellent 96.3% |
| Immigrants | Greece | 85.9 /100 | #144 | Excellent 96.3% |
| Blackfeet | 83.9 /100 | #145 | Excellent 96.3% |
| Immigrants | Eastern Europe | 83.7 /100 | #146 | Excellent 96.3% |
| French American Indians | 83.1 /100 | #147 | Excellent 96.3% |
| Israelis | 82.8 /100 | #148 | Excellent 96.3% |