Immigrants from Northern Europe vs Immigrants from Iran GED/Equivalency
COMPARE
Immigrants from Northern Europe
Immigrants from Iran
GED/Equivalency
GED/Equivalency Comparison
Immigrants from Northern Europe
Immigrants from Iran
88.5%
GED/EQUIVALENCY
99.8/ 100
METRIC RATING
28th/ 347
METRIC RANK
88.9%
GED/EQUIVALENCY
99.9/ 100
METRIC RATING
13th/ 347
METRIC RANK
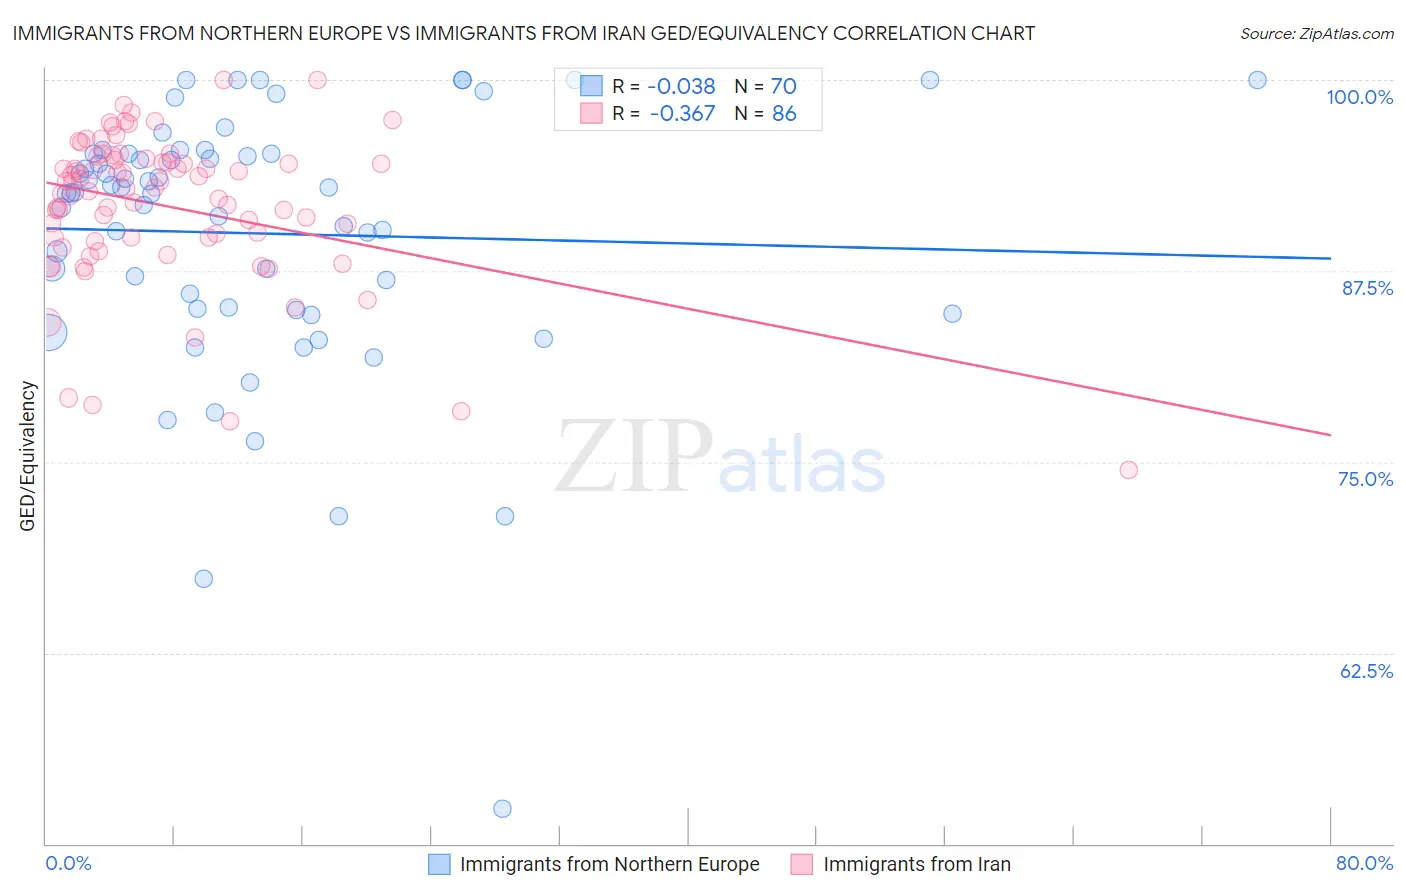
Immigrants from Northern Europe vs Immigrants from Iran GED/Equivalency Correlation Chart
The statistical analysis conducted on geographies consisting of 477,226,871 people shows no correlation between the proportion of Immigrants from Northern Europe and percentage of population with at least ged/equivalency education in the United States with a correlation coefficient (R) of -0.038 and weighted average of 88.5%. Similarly, the statistical analysis conducted on geographies consisting of 279,904,902 people shows a mild negative correlation between the proportion of Immigrants from Iran and percentage of population with at least ged/equivalency education in the United States with a correlation coefficient (R) of -0.367 and weighted average of 88.9%, a difference of 0.46%.
GED/Equivalency Correlation Summary
| Measurement | Immigrants from Northern Europe | Immigrants from Iran |
| Minimum | 52.3% | 74.5% |
| Maximum | 100.0% | 100.0% |
| Range | 47.7% | 25.5% |
| Mean | 90.0% | 91.8% |
| Median | 92.6% | 92.9% |
| Interquartile 25% (IQ1) | 85.1% | 89.7% |
| Interquartile 75% (IQ3) | 95.2% | 94.8% |
| Interquartile Range (IQR) | 10.2% | 5.1% |
| Standard Deviation (Sample) | 8.7% | 4.9% |
| Standard Deviation (Population) | 8.7% | 4.9% |
Demographics Similar to Immigrants from Northern Europe and Immigrants from Iran by GED/Equivalency
In terms of ged/equivalency, the demographic groups most similar to Immigrants from Northern Europe are Polish (88.5%, a difference of 0.030%), Immigrants from Lithuania (88.6%, a difference of 0.040%), Turkish (88.5%, a difference of 0.050%), Russian (88.6%, a difference of 0.080%), and Slovak (88.6%, a difference of 0.080%). Similarly, the demographic groups most similar to Immigrants from Iran are Lithuanian (88.9%, a difference of 0.010%), Cypriot (88.9%, a difference of 0.030%), Bulgarian (89.0%, a difference of 0.050%), Okinawan (88.9%, a difference of 0.050%), and Norwegian (89.0%, a difference of 0.080%).
| Demographics | Rating | Rank | GED/Equivalency |
| Norwegians | 99.9 /100 | #10 | Exceptional 89.0% |
| Bulgarians | 99.9 /100 | #11 | Exceptional 89.0% |
| Lithuanians | 99.9 /100 | #12 | Exceptional 88.9% |
| Immigrants | Iran | 99.9 /100 | #13 | Exceptional 88.9% |
| Cypriots | 99.9 /100 | #14 | Exceptional 88.9% |
| Okinawans | 99.9 /100 | #15 | Exceptional 88.9% |
| Immigrants | Taiwan | 99.9 /100 | #16 | Exceptional 88.8% |
| Croatians | 99.9 /100 | #17 | Exceptional 88.8% |
| Slovenes | 99.9 /100 | #18 | Exceptional 88.8% |
| Swedes | 99.9 /100 | #19 | Exceptional 88.8% |
| Maltese | 99.9 /100 | #20 | Exceptional 88.6% |
| Luxembourgers | 99.8 /100 | #21 | Exceptional 88.6% |
| Immigrants | Ireland | 99.8 /100 | #22 | Exceptional 88.6% |
| Russians | 99.8 /100 | #23 | Exceptional 88.6% |
| Slovaks | 99.8 /100 | #24 | Exceptional 88.6% |
| Estonians | 99.8 /100 | #25 | Exceptional 88.6% |
| Immigrants | Australia | 99.8 /100 | #26 | Exceptional 88.6% |
| Immigrants | Lithuania | 99.8 /100 | #27 | Exceptional 88.6% |
| Immigrants | Northern Europe | 99.8 /100 | #28 | Exceptional 88.5% |
| Poles | 99.8 /100 | #29 | Exceptional 88.5% |
| Turks | 99.8 /100 | #30 | Exceptional 88.5% |