Immigrants from Portugal vs Thai 11th Grade
COMPARE
Immigrants from Portugal
Thai
11th Grade
11th Grade Comparison
Immigrants from Portugal
Thais
89.3%
11TH GRADE
0.0/ 100
METRIC RATING
312th/ 347
METRIC RANK
94.1%
11TH GRADE
99.9/ 100
METRIC RATING
40th/ 347
METRIC RANK
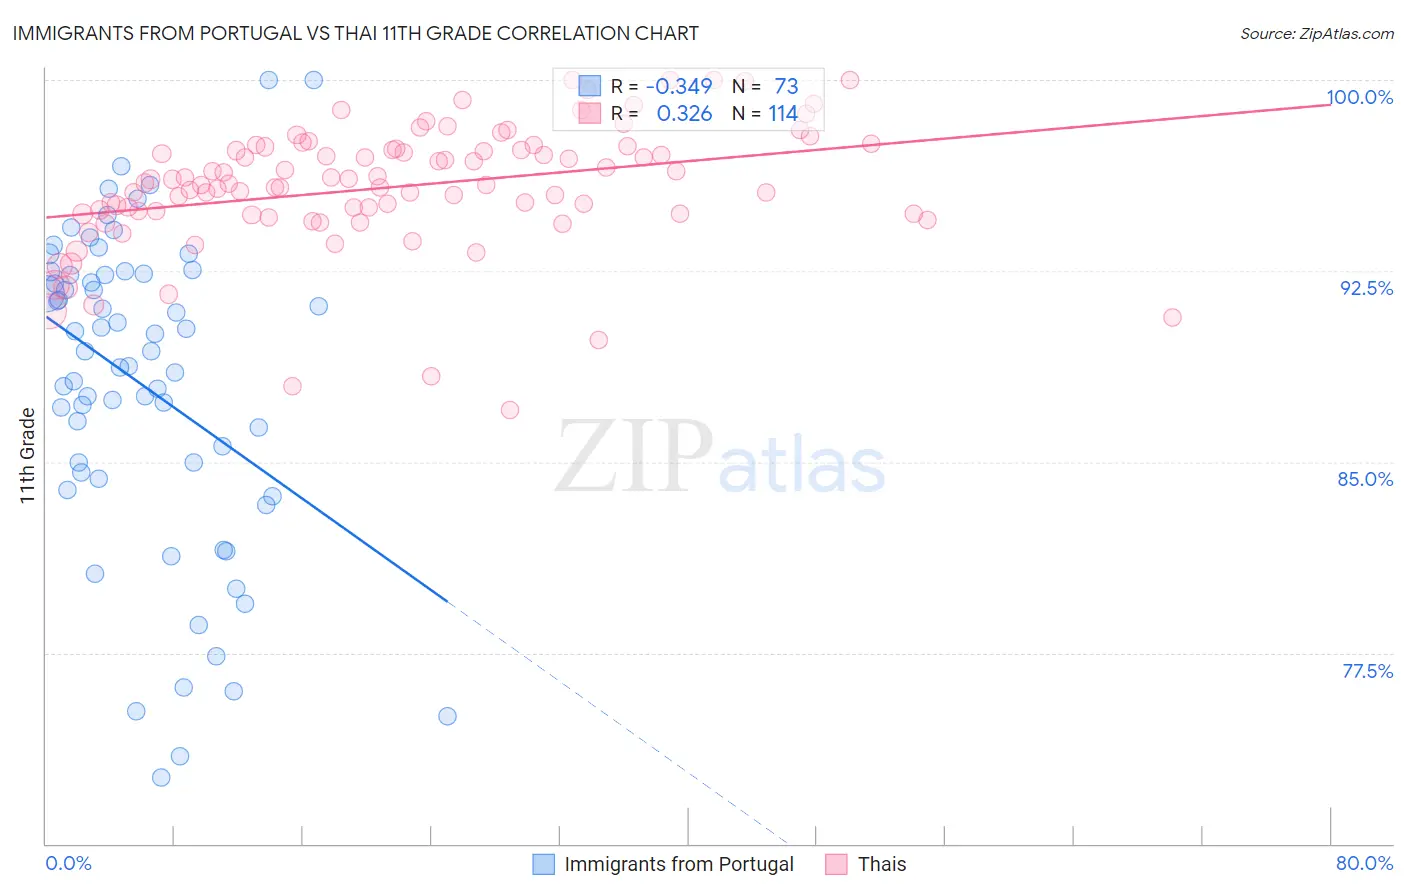
Immigrants from Portugal vs Thai 11th Grade Correlation Chart
The statistical analysis conducted on geographies consisting of 174,792,107 people shows a mild negative correlation between the proportion of Immigrants from Portugal and percentage of population with at least 11th grade education in the United States with a correlation coefficient (R) of -0.349 and weighted average of 89.3%. Similarly, the statistical analysis conducted on geographies consisting of 475,814,962 people shows a mild positive correlation between the proportion of Thais and percentage of population with at least 11th grade education in the United States with a correlation coefficient (R) of 0.326 and weighted average of 94.1%, a difference of 5.4%.
11th Grade Correlation Summary
| Measurement | Immigrants from Portugal | Thai |
| Minimum | 72.6% | 87.0% |
| Maximum | 100.0% | 100.0% |
| Range | 27.4% | 13.0% |
| Mean | 88.0% | 95.8% |
| Median | 89.3% | 95.9% |
| Interquartile 25% (IQ1) | 84.4% | 94.7% |
| Interquartile 75% (IQ3) | 92.4% | 97.3% |
| Interquartile Range (IQR) | 7.9% | 2.6% |
| Standard Deviation (Sample) | 6.2% | 2.5% |
| Standard Deviation (Population) | 6.2% | 2.5% |
Similar Demographics by 11th Grade
Demographics Similar to Immigrants from Portugal by 11th Grade
In terms of 11th grade, the demographic groups most similar to Immigrants from Portugal are Vietnamese (89.4%, a difference of 0.18%), Immigrants from Caribbean (89.1%, a difference of 0.20%), Cape Verdean (89.1%, a difference of 0.22%), Immigrants from Ecuador (89.1%, a difference of 0.23%), and Yaqui (89.5%, a difference of 0.24%).
| Demographics | Rating | Rank | 11th Grade |
| Immigrants | Cambodia | 0.0 /100 | #305 | Tragic 89.6% |
| Ecuadorians | 0.0 /100 | #306 | Tragic 89.6% |
| Immigrants | Dominica | 0.0 /100 | #307 | Tragic 89.5% |
| Nepalese | 0.0 /100 | #308 | Tragic 89.5% |
| Immigrants | Bangladesh | 0.0 /100 | #309 | Tragic 89.5% |
| Yaqui | 0.0 /100 | #310 | Tragic 89.5% |
| Vietnamese | 0.0 /100 | #311 | Tragic 89.4% |
| Immigrants | Portugal | 0.0 /100 | #312 | Tragic 89.3% |
| Immigrants | Caribbean | 0.0 /100 | #313 | Tragic 89.1% |
| Cape Verdeans | 0.0 /100 | #314 | Tragic 89.1% |
| Immigrants | Ecuador | 0.0 /100 | #315 | Tragic 89.1% |
| Immigrants | Cuba | 0.0 /100 | #316 | Tragic 88.9% |
| Lumbee | 0.0 /100 | #317 | Tragic 88.9% |
| Nicaraguans | 0.0 /100 | #318 | Tragic 88.9% |
| Belizeans | 0.0 /100 | #319 | Tragic 88.8% |
Demographics Similar to Thais by 11th Grade
In terms of 11th grade, the demographic groups most similar to Thais are Immigrants from Lithuania (94.1%, a difference of 0.0%), Cypriot (94.1%, a difference of 0.010%), Immigrants from Austria (94.1%, a difference of 0.020%), Greek (94.1%, a difference of 0.020%), and Immigrants from Ireland (94.1%, a difference of 0.030%).
| Demographics | Rating | Rank | 11th Grade |
| British | 99.9 /100 | #33 | Exceptional 94.2% |
| Immigrants | Scotland | 99.9 /100 | #34 | Exceptional 94.2% |
| Immigrants | Singapore | 99.9 /100 | #35 | Exceptional 94.2% |
| Immigrants | Northern Europe | 99.9 /100 | #36 | Exceptional 94.2% |
| Northern Europeans | 99.9 /100 | #37 | Exceptional 94.2% |
| Hungarians | 99.9 /100 | #38 | Exceptional 94.2% |
| Immigrants | Lithuania | 99.9 /100 | #39 | Exceptional 94.1% |
| Thais | 99.9 /100 | #40 | Exceptional 94.1% |
| Cypriots | 99.9 /100 | #41 | Exceptional 94.1% |
| Immigrants | Austria | 99.9 /100 | #42 | Exceptional 94.1% |
| Greeks | 99.9 /100 | #43 | Exceptional 94.1% |
| Immigrants | Ireland | 99.9 /100 | #44 | Exceptional 94.1% |
| Australians | 99.9 /100 | #45 | Exceptional 94.1% |
| Serbians | 99.9 /100 | #46 | Exceptional 94.1% |
| Filipinos | 99.9 /100 | #47 | Exceptional 94.1% |