Immigrants from Saudi Arabia vs Immigrants from Western Africa 6th Grade
COMPARE
Immigrants from Saudi Arabia
Immigrants from Western Africa
6th Grade
6th Grade Comparison
Immigrants from Saudi Arabia
Immigrants from Western Africa
97.4%
6TH GRADE
96.5/ 100
METRIC RATING
113th/ 347
METRIC RANK
96.3%
6TH GRADE
0.1/ 100
METRIC RATING
277th/ 347
METRIC RANK
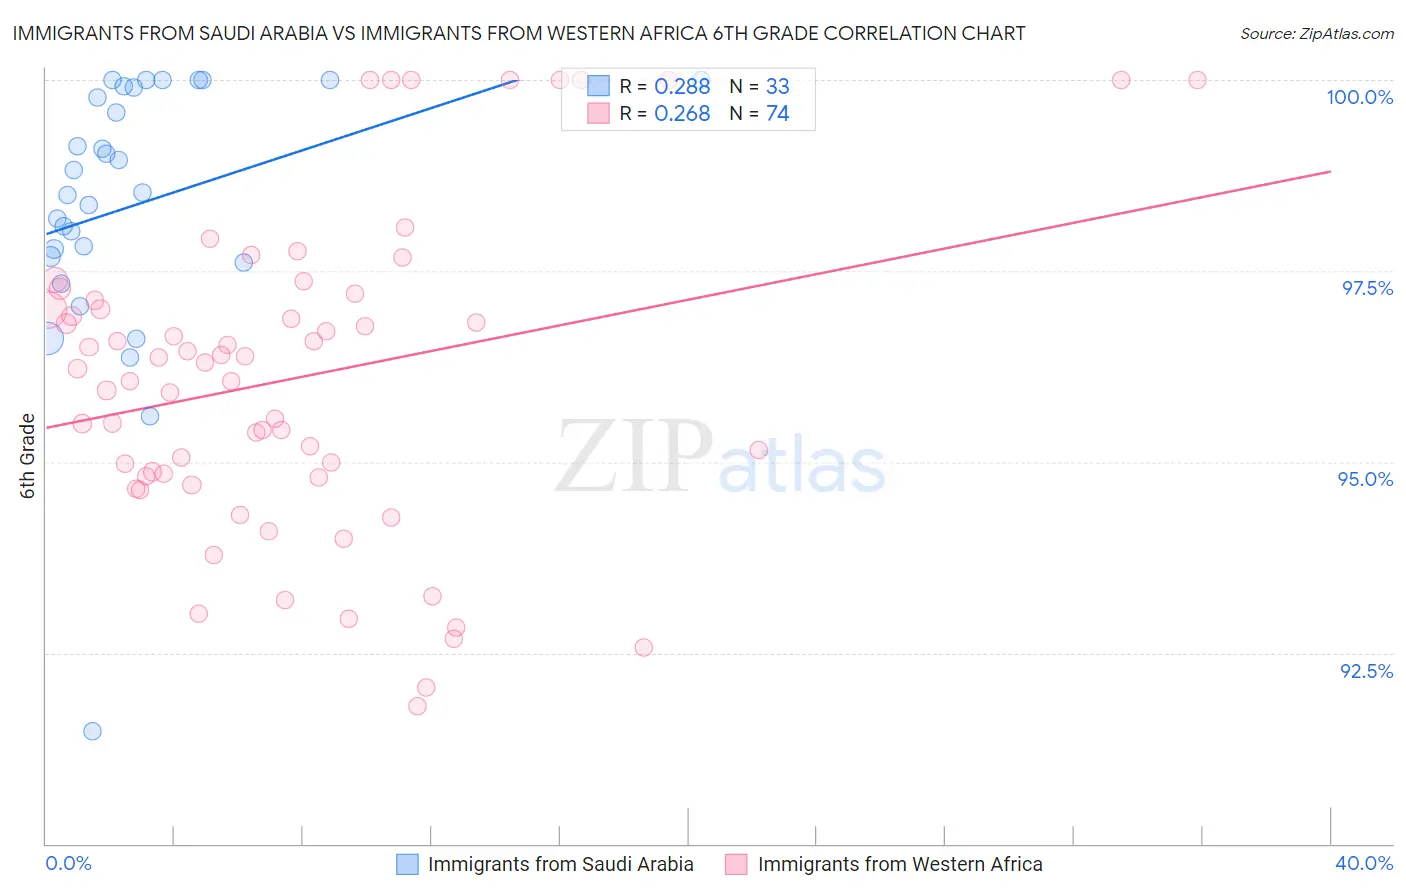
Immigrants from Saudi Arabia vs Immigrants from Western Africa 6th Grade Correlation Chart
The statistical analysis conducted on geographies consisting of 164,277,573 people shows a weak positive correlation between the proportion of Immigrants from Saudi Arabia and percentage of population with at least 6th grade education in the United States with a correlation coefficient (R) of 0.288 and weighted average of 97.4%. Similarly, the statistical analysis conducted on geographies consisting of 357,809,696 people shows a weak positive correlation between the proportion of Immigrants from Western Africa and percentage of population with at least 6th grade education in the United States with a correlation coefficient (R) of 0.268 and weighted average of 96.3%, a difference of 1.2%.
6th Grade Correlation Summary
| Measurement | Immigrants from Saudi Arabia | Immigrants from Western Africa |
| Minimum | 91.5% | 91.8% |
| Maximum | 100.0% | 100.0% |
| Range | 8.5% | 8.2% |
| Mean | 98.4% | 96.1% |
| Median | 98.5% | 96.3% |
| Interquartile 25% (IQ1) | 97.6% | 94.8% |
| Interquartile 75% (IQ3) | 99.9% | 97.1% |
| Interquartile Range (IQR) | 2.3% | 2.3% |
| Standard Deviation (Sample) | 1.8% | 2.1% |
| Standard Deviation (Population) | 1.7% | 2.1% |
Similar Demographics by 6th Grade
Demographics Similar to Immigrants from Saudi Arabia by 6th Grade
In terms of 6th grade, the demographic groups most similar to Immigrants from Saudi Arabia are Colville (97.4%, a difference of 0.0%), Iroquois (97.4%, a difference of 0.010%), Immigrants from Latvia (97.4%, a difference of 0.010%), Thai (97.4%, a difference of 0.020%), and Immigrants from Switzerland (97.4%, a difference of 0.020%).
| Demographics | Rating | Rank | 6th Grade |
| Menominee | 97.7 /100 | #106 | Exceptional 97.5% |
| Immigrants | Singapore | 97.6 /100 | #107 | Exceptional 97.5% |
| Immigrants | Nonimmigrants | 97.3 /100 | #108 | Exceptional 97.4% |
| Immigrants | Czechoslovakia | 97.3 /100 | #109 | Exceptional 97.4% |
| Thais | 96.9 /100 | #110 | Exceptional 97.4% |
| Iroquois | 96.9 /100 | #111 | Exceptional 97.4% |
| Immigrants | Latvia | 96.7 /100 | #112 | Exceptional 97.4% |
| Immigrants | Saudi Arabia | 96.5 /100 | #113 | Exceptional 97.4% |
| Colville | 96.4 /100 | #114 | Exceptional 97.4% |
| Immigrants | Switzerland | 95.7 /100 | #115 | Exceptional 97.4% |
| Lebanese | 95.5 /100 | #116 | Exceptional 97.4% |
| Basques | 95.4 /100 | #117 | Exceptional 97.4% |
| Immigrants | Japan | 95.2 /100 | #118 | Exceptional 97.4% |
| Immigrants | Zimbabwe | 95.0 /100 | #119 | Exceptional 97.4% |
| Syrians | 94.8 /100 | #120 | Exceptional 97.4% |
Demographics Similar to Immigrants from Western Africa by 6th Grade
In terms of 6th grade, the demographic groups most similar to Immigrants from Western Africa are Immigrants from Thailand (96.3%, a difference of 0.0%), Yaqui (96.3%, a difference of 0.010%), Immigrants from Ghana (96.3%, a difference of 0.020%), Immigrants from Peru (96.2%, a difference of 0.020%), and Immigrants from Afghanistan (96.2%, a difference of 0.020%).
| Demographics | Rating | Rank | 6th Grade |
| Immigrants | South America | 0.2 /100 | #270 | Tragic 96.3% |
| Immigrants | Hong Kong | 0.2 /100 | #271 | Tragic 96.3% |
| Immigrants | Bolivia | 0.1 /100 | #272 | Tragic 96.3% |
| Immigrants | Cameroon | 0.1 /100 | #273 | Tragic 96.3% |
| Immigrants | Philippines | 0.1 /100 | #274 | Tragic 96.3% |
| Immigrants | Ghana | 0.1 /100 | #275 | Tragic 96.3% |
| Yaqui | 0.1 /100 | #276 | Tragic 96.3% |
| Immigrants | Western Africa | 0.1 /100 | #277 | Tragic 96.3% |
| Immigrants | Thailand | 0.1 /100 | #278 | Tragic 96.3% |
| Immigrants | Peru | 0.1 /100 | #279 | Tragic 96.2% |
| Immigrants | Afghanistan | 0.1 /100 | #280 | Tragic 96.2% |
| Trinidadians and Tobagonians | 0.1 /100 | #281 | Tragic 96.2% |
| Houma | 0.1 /100 | #282 | Tragic 96.2% |
| Cubans | 0.1 /100 | #283 | Tragic 96.2% |
| Fijians | 0.1 /100 | #284 | Tragic 96.2% |