Immigrants from South Eastern Asia vs Immigrants from Israel Doctorate Degree
COMPARE
Immigrants from South Eastern Asia
Immigrants from Israel
Doctorate Degree
Doctorate Degree Comparison
Immigrants from South Eastern Asia
Immigrants from Israel
1.7%
DOCTORATE DEGREE
14.7/ 100
METRIC RATING
212th/ 347
METRIC RANK
3.0%
DOCTORATE DEGREE
100.0/ 100
METRIC RATING
8th/ 347
METRIC RANK
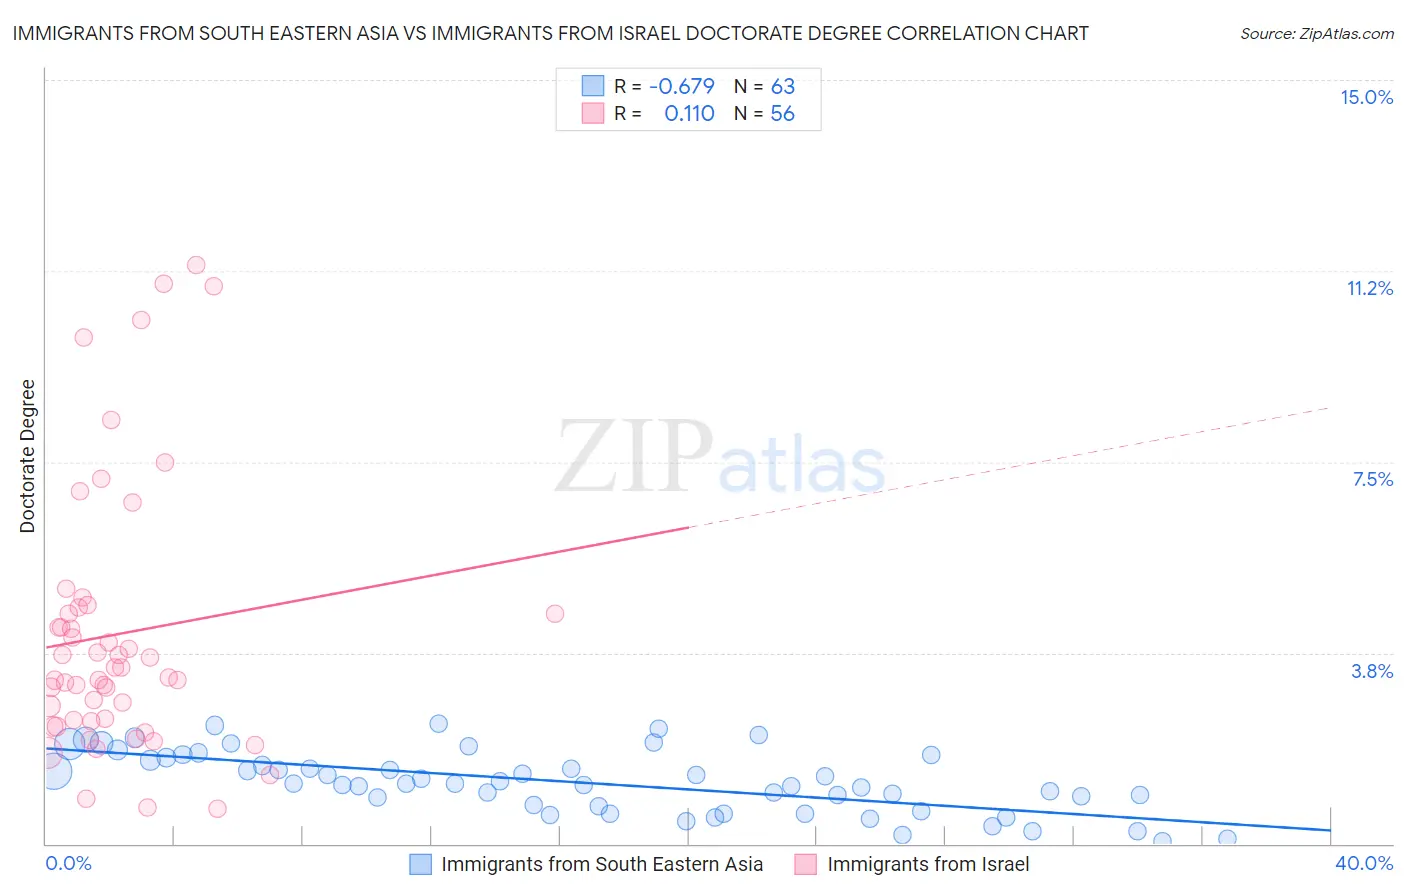
Immigrants from South Eastern Asia vs Immigrants from Israel Doctorate Degree Correlation Chart
The statistical analysis conducted on geographies consisting of 502,144,832 people shows a significant negative correlation between the proportion of Immigrants from South Eastern Asia and percentage of population with at least doctorate degree education in the United States with a correlation coefficient (R) of -0.679 and weighted average of 1.7%. Similarly, the statistical analysis conducted on geographies consisting of 209,560,574 people shows a poor positive correlation between the proportion of Immigrants from Israel and percentage of population with at least doctorate degree education in the United States with a correlation coefficient (R) of 0.110 and weighted average of 3.0%, a difference of 77.1%.
Doctorate Degree Correlation Summary
| Measurement | Immigrants from South Eastern Asia | Immigrants from Israel |
| Minimum | 0.043% | 0.70% |
| Maximum | 2.3% | 11.4% |
| Range | 2.3% | 10.7% |
| Mean | 1.2% | 4.1% |
| Median | 1.2% | 3.4% |
| Interquartile 25% (IQ1) | 0.74% | 2.4% |
| Interquartile 75% (IQ3) | 1.7% | 4.6% |
| Interquartile Range (IQR) | 0.96% | 2.2% |
| Standard Deviation (Sample) | 0.60% | 2.6% |
| Standard Deviation (Population) | 0.59% | 2.6% |
Similar Demographics by Doctorate Degree
Demographics Similar to Immigrants from South Eastern Asia by Doctorate Degree
In terms of doctorate degree, the demographic groups most similar to Immigrants from South Eastern Asia are Immigrants from Armenia (1.7%, a difference of 0.13%), Tongan (1.7%, a difference of 0.14%), Korean (1.7%, a difference of 0.15%), Pueblo (1.7%, a difference of 0.15%), and Immigrants from Western Africa (1.7%, a difference of 0.22%).
| Demographics | Rating | Rank | Doctorate Degree |
| Venezuelans | 19.5 /100 | #205 | Poor 1.7% |
| Immigrants | Peru | 17.6 /100 | #206 | Poor 1.7% |
| Yugoslavians | 17.1 /100 | #207 | Poor 1.7% |
| Colombians | 16.1 /100 | #208 | Poor 1.7% |
| Immigrants | Western Africa | 15.4 /100 | #209 | Poor 1.7% |
| Tongans | 15.1 /100 | #210 | Poor 1.7% |
| Immigrants | Armenia | 15.1 /100 | #211 | Poor 1.7% |
| Immigrants | South Eastern Asia | 14.7 /100 | #212 | Poor 1.7% |
| Koreans | 14.2 /100 | #213 | Poor 1.7% |
| Pueblo | 14.2 /100 | #214 | Poor 1.7% |
| Alaskan Athabascans | 13.8 /100 | #215 | Poor 1.7% |
| Immigrants | Burma/Myanmar | 13.5 /100 | #216 | Poor 1.7% |
| Spanish Americans | 12.9 /100 | #217 | Poor 1.7% |
| Tlingit-Haida | 11.9 /100 | #218 | Poor 1.7% |
| Immigrants | Iraq | 10.7 /100 | #219 | Poor 1.7% |
Demographics Similar to Immigrants from Israel by Doctorate Degree
In terms of doctorate degree, the demographic groups most similar to Immigrants from Israel are Immigrants from Iran (3.0%, a difference of 0.67%), Immigrants from China (3.1%, a difference of 1.3%), Immigrants from Switzerland (3.1%, a difference of 1.4%), Immigrants from Eastern Asia (3.0%, a difference of 2.8%), and Iranian (3.1%, a difference of 3.3%).
| Demographics | Rating | Rank | Doctorate Degree |
| Immigrants | Singapore | 100.0 /100 | #1 | Exceptional 3.7% |
| Filipinos | 100.0 /100 | #2 | Exceptional 3.4% |
| Okinawans | 100.0 /100 | #3 | Exceptional 3.3% |
| Immigrants | Taiwan | 100.0 /100 | #4 | Exceptional 3.2% |
| Iranians | 100.0 /100 | #5 | Exceptional 3.1% |
| Immigrants | Switzerland | 100.0 /100 | #6 | Exceptional 3.1% |
| Immigrants | China | 100.0 /100 | #7 | Exceptional 3.1% |
| Immigrants | Israel | 100.0 /100 | #8 | Exceptional 3.0% |
| Immigrants | Iran | 100.0 /100 | #9 | Exceptional 3.0% |
| Immigrants | Eastern Asia | 100.0 /100 | #10 | Exceptional 3.0% |
| Indians (Asian) | 100.0 /100 | #11 | Exceptional 2.9% |
| Immigrants | Belgium | 100.0 /100 | #12 | Exceptional 2.9% |
| Immigrants | Sweden | 100.0 /100 | #13 | Exceptional 2.9% |
| Immigrants | France | 100.0 /100 | #14 | Exceptional 2.9% |
| Immigrants | India | 100.0 /100 | #15 | Exceptional 2.8% |