Immigrants from Spain vs Nonimmigrants 3rd Grade
COMPARE
Immigrants from Spain
Nonimmigrants
3rd Grade
3rd Grade Comparison
Immigrants from Spain
Nonimmigrants
97.8%
3RD GRADE
54.3/ 100
METRIC RATING
168th/ 347
METRIC RANK
98.1%
3RD GRADE
97.8/ 100
METRIC RATING
102nd/ 347
METRIC RANK
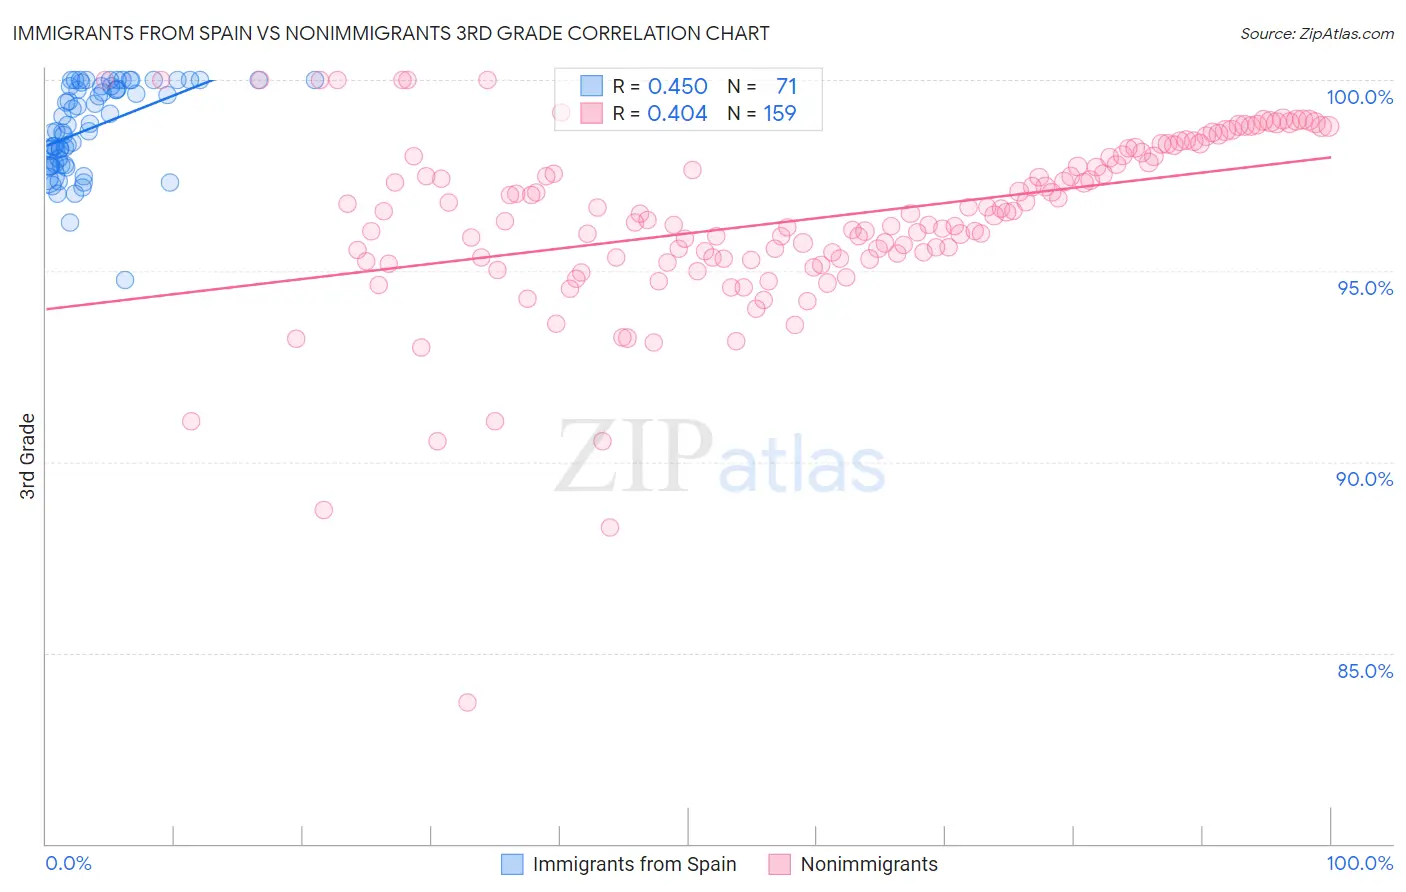
Immigrants from Spain vs Nonimmigrants 3rd Grade Correlation Chart
The statistical analysis conducted on geographies consisting of 239,682,160 people shows a moderate positive correlation between the proportion of Immigrants from Spain and percentage of population with at least 3rd grade education in the United States with a correlation coefficient (R) of 0.450 and weighted average of 97.8%. Similarly, the statistical analysis conducted on geographies consisting of 585,374,774 people shows a moderate positive correlation between the proportion of Nonimmigrants and percentage of population with at least 3rd grade education in the United States with a correlation coefficient (R) of 0.404 and weighted average of 98.1%, a difference of 0.31%.
3rd Grade Correlation Summary
| Measurement | Immigrants from Spain | Nonimmigrants |
| Minimum | 94.8% | 83.7% |
| Maximum | 100.0% | 100.0% |
| Range | 5.2% | 16.3% |
| Mean | 98.8% | 96.4% |
| Median | 98.8% | 96.5% |
| Interquartile 25% (IQ1) | 97.8% | 95.3% |
| Interquartile 75% (IQ3) | 99.8% | 98.0% |
| Interquartile Range (IQR) | 2.1% | 2.7% |
| Standard Deviation (Sample) | 1.1% | 2.3% |
| Standard Deviation (Population) | 1.1% | 2.3% |
Similar Demographics by 3rd Grade
Demographics Similar to Immigrants from Spain by 3rd Grade
In terms of 3rd grade, the demographic groups most similar to Immigrants from Spain are Dutch West Indian (97.8%, a difference of 0.0%), Chilean (97.8%, a difference of 0.0%), Comanche (97.8%, a difference of 0.0%), Brazilian (97.8%, a difference of 0.0%), and Immigrants from Jordan (97.8%, a difference of 0.010%).
| Demographics | Rating | Rank | 3rd Grade |
| Albanians | 58.8 /100 | #161 | Average 97.8% |
| Immigrants | Jordan | 57.9 /100 | #162 | Average 97.8% |
| Marshallese | 57.2 /100 | #163 | Average 97.8% |
| Immigrants | Bosnia and Herzegovina | 56.2 /100 | #164 | Average 97.8% |
| Ugandans | 56.1 /100 | #165 | Average 97.8% |
| Dutch West Indians | 55.5 /100 | #166 | Average 97.8% |
| Chileans | 55.3 /100 | #167 | Average 97.8% |
| Immigrants | Spain | 54.3 /100 | #168 | Average 97.8% |
| Comanche | 53.8 /100 | #169 | Average 97.8% |
| Brazilians | 53.7 /100 | #170 | Average 97.8% |
| Kenyans | 51.8 /100 | #171 | Average 97.8% |
| Spanish Americans | 51.8 /100 | #172 | Average 97.8% |
| Immigrants | Korea | 50.9 /100 | #173 | Average 97.8% |
| Navajo | 50.0 /100 | #174 | Average 97.8% |
| Immigrants | Micronesia | 47.6 /100 | #175 | Average 97.8% |
Demographics Similar to Nonimmigrants by 3rd Grade
In terms of 3rd grade, the demographic groups most similar to Nonimmigrants are Cree (98.1%, a difference of 0.0%), Puget Sound Salish (98.1%, a difference of 0.0%), South African (98.1%, a difference of 0.010%), Choctaw (98.1%, a difference of 0.010%), and Romanian (98.1%, a difference of 0.010%).
| Demographics | Rating | Rank | 3rd Grade |
| Cypriots | 98.4 /100 | #95 | Exceptional 98.1% |
| Immigrants | Ireland | 98.2 /100 | #96 | Exceptional 98.1% |
| South Africans | 98.2 /100 | #97 | Exceptional 98.1% |
| Choctaw | 98.0 /100 | #98 | Exceptional 98.1% |
| Romanians | 98.0 /100 | #99 | Exceptional 98.1% |
| Cree | 97.9 /100 | #100 | Exceptional 98.1% |
| Puget Sound Salish | 97.9 /100 | #101 | Exceptional 98.1% |
| Immigrants | Nonimmigrants | 97.8 /100 | #102 | Exceptional 98.1% |
| Yugoslavians | 97.7 /100 | #103 | Exceptional 98.1% |
| Turks | 97.6 /100 | #104 | Exceptional 98.1% |
| German Russians | 97.2 /100 | #105 | Exceptional 98.1% |
| Bhutanese | 97.2 /100 | #106 | Exceptional 98.1% |
| Immigrants | Czechoslovakia | 97.0 /100 | #107 | Exceptional 98.0% |
| Immigrants | Singapore | 96.7 /100 | #108 | Exceptional 98.0% |
| Pima | 96.7 /100 | #109 | Exceptional 98.0% |