Immigrants from St. Vincent and the Grenadines vs Immigrants from Iraq 7th Grade
COMPARE
Immigrants from St. Vincent and the Grenadines
Immigrants from Iraq
7th Grade
7th Grade Comparison
Immigrants from St. Vincent and the Grenadines
Immigrants from Iraq
95.0%
7TH GRADE
0.1/ 100
METRIC RATING
280th/ 347
METRIC RANK
96.0%
7TH GRADE
36.1/ 100
METRIC RATING
186th/ 347
METRIC RANK
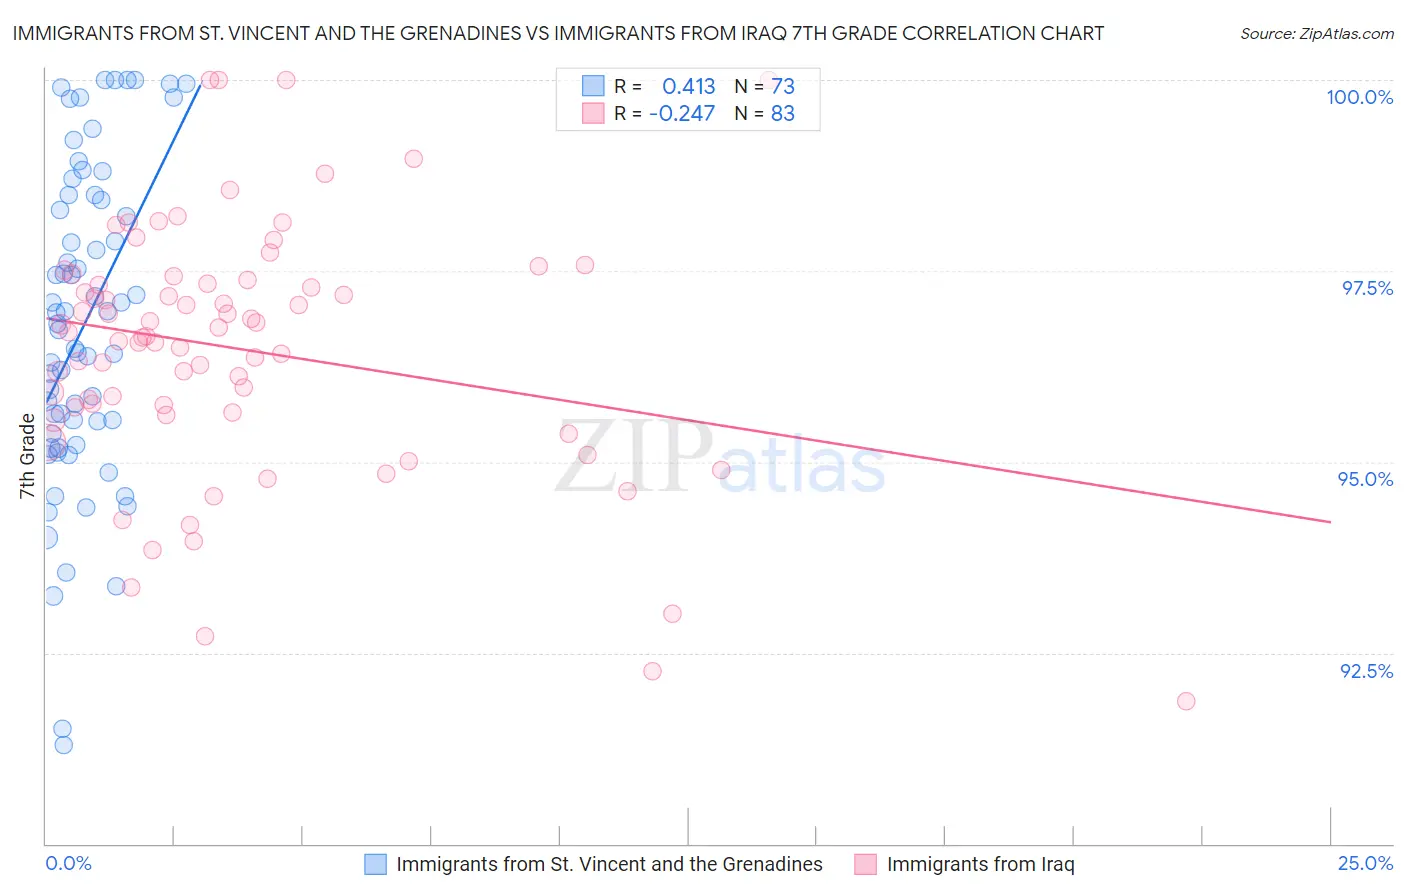
Immigrants from St. Vincent and the Grenadines vs Immigrants from Iraq 7th Grade Correlation Chart
The statistical analysis conducted on geographies consisting of 56,191,418 people shows a moderate positive correlation between the proportion of Immigrants from St. Vincent and the Grenadines and percentage of population with at least 7th grade education in the United States with a correlation coefficient (R) of 0.413 and weighted average of 95.0%. Similarly, the statistical analysis conducted on geographies consisting of 194,632,332 people shows a weak negative correlation between the proportion of Immigrants from Iraq and percentage of population with at least 7th grade education in the United States with a correlation coefficient (R) of -0.247 and weighted average of 96.0%, a difference of 0.98%.
7th Grade Correlation Summary
| Measurement | Immigrants from St. Vincent and the Grenadines | Immigrants from Iraq |
| Minimum | 91.3% | 91.9% |
| Maximum | 100.0% | 100.0% |
| Range | 8.7% | 8.1% |
| Mean | 96.8% | 96.5% |
| Median | 96.8% | 96.6% |
| Interquartile 25% (IQ1) | 95.3% | 95.7% |
| Interquartile 75% (IQ3) | 98.5% | 97.4% |
| Interquartile Range (IQR) | 3.2% | 1.7% |
| Standard Deviation (Sample) | 2.1% | 1.7% |
| Standard Deviation (Population) | 2.1% | 1.6% |
Similar Demographics by 7th Grade
Demographics Similar to Immigrants from St. Vincent and the Grenadines by 7th Grade
In terms of 7th grade, the demographic groups most similar to Immigrants from St. Vincent and the Grenadines are Tohono O'odham (95.0%, a difference of 0.0%), Immigrants from Bolivia (95.0%, a difference of 0.010%), Immigrants from Trinidad and Tobago (95.1%, a difference of 0.030%), Barbadian (95.1%, a difference of 0.030%), and Immigrants from Afghanistan (95.1%, a difference of 0.070%).
| Demographics | Rating | Rank | 7th Grade |
| Immigrants | Uzbekistan | 0.2 /100 | #273 | Tragic 95.1% |
| Immigrants | Western Africa | 0.2 /100 | #274 | Tragic 95.1% |
| Immigrants | Colombia | 0.2 /100 | #275 | Tragic 95.1% |
| Immigrants | Thailand | 0.2 /100 | #276 | Tragic 95.1% |
| Immigrants | Afghanistan | 0.2 /100 | #277 | Tragic 95.1% |
| Immigrants | Trinidad and Tobago | 0.1 /100 | #278 | Tragic 95.1% |
| Barbadians | 0.1 /100 | #279 | Tragic 95.1% |
| Immigrants | St. Vincent and the Grenadines | 0.1 /100 | #280 | Tragic 95.0% |
| Tohono O'odham | 0.1 /100 | #281 | Tragic 95.0% |
| Immigrants | Bolivia | 0.1 /100 | #282 | Tragic 95.0% |
| Immigrants | Barbados | 0.1 /100 | #283 | Tragic 95.0% |
| Armenians | 0.1 /100 | #284 | Tragic 95.0% |
| Immigrants | Eritrea | 0.1 /100 | #285 | Tragic 94.9% |
| Immigrants | Philippines | 0.0 /100 | #286 | Tragic 94.9% |
| Immigrants | Peru | 0.0 /100 | #287 | Tragic 94.9% |
Demographics Similar to Immigrants from Iraq by 7th Grade
In terms of 7th grade, the demographic groups most similar to Immigrants from Iraq are Immigrants from Uganda (96.0%, a difference of 0.0%), Sierra Leonean (96.0%, a difference of 0.010%), Brazilian (96.0%, a difference of 0.010%), Immigrants from Egypt (95.9%, a difference of 0.010%), and Immigrants from Venezuela (95.9%, a difference of 0.010%).
| Demographics | Rating | Rank | 7th Grade |
| Immigrants | Iran | 47.8 /100 | #179 | Average 96.0% |
| Immigrants | Brazil | 46.8 /100 | #180 | Average 96.0% |
| Pakistanis | 44.5 /100 | #181 | Average 96.0% |
| Iraqis | 41.2 /100 | #182 | Average 96.0% |
| Immigrants | Spain | 38.8 /100 | #183 | Fair 96.0% |
| Sierra Leoneans | 37.5 /100 | #184 | Fair 96.0% |
| Brazilians | 37.3 /100 | #185 | Fair 96.0% |
| Immigrants | Iraq | 36.1 /100 | #186 | Fair 96.0% |
| Immigrants | Uganda | 36.0 /100 | #187 | Fair 96.0% |
| Immigrants | Egypt | 34.3 /100 | #188 | Fair 95.9% |
| Immigrants | Venezuela | 33.9 /100 | #189 | Fair 95.9% |
| Immigrants | Micronesia | 32.6 /100 | #190 | Fair 95.9% |
| Liberians | 32.5 /100 | #191 | Fair 95.9% |
| Panamanians | 32.3 /100 | #192 | Fair 95.9% |
| Immigrants | Bahamas | 30.8 /100 | #193 | Fair 95.9% |