Immigrants from Sudan vs Immigrants from the Azores 3rd Grade
COMPARE
Immigrants from Sudan
Immigrants from the Azores
3rd Grade
3rd Grade Comparison
Immigrants from Sudan
Immigrants from the Azores
97.5%
3RD GRADE
3.4/ 100
METRIC RATING
227th/ 347
METRIC RANK
96.6%
3RD GRADE
0.0/ 100
METRIC RATING
315th/ 347
METRIC RANK
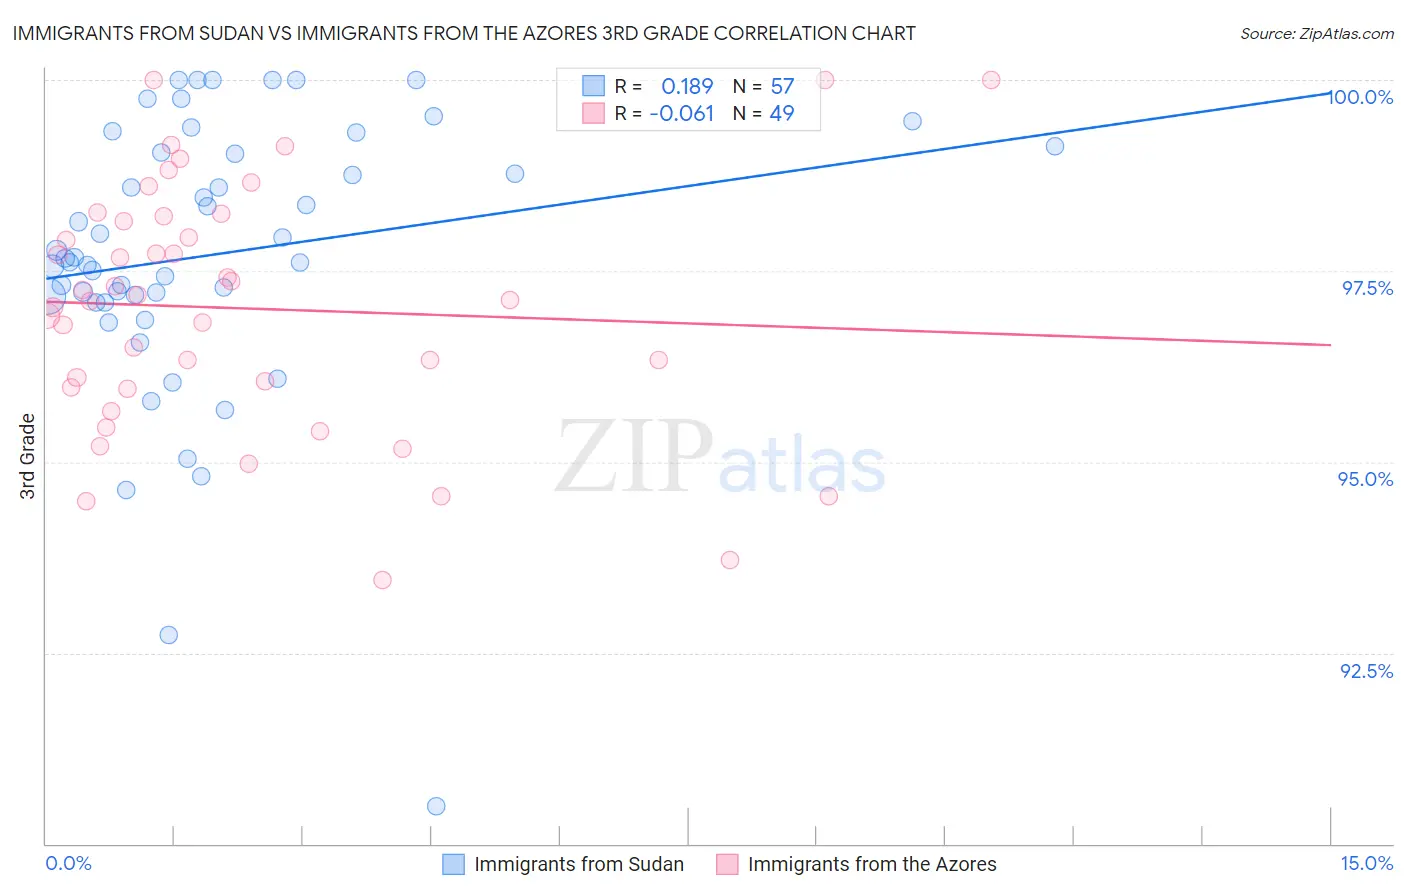
Immigrants from Sudan vs Immigrants from the Azores 3rd Grade Correlation Chart
The statistical analysis conducted on geographies consisting of 118,965,188 people shows a poor positive correlation between the proportion of Immigrants from Sudan and percentage of population with at least 3rd grade education in the United States with a correlation coefficient (R) of 0.189 and weighted average of 97.5%. Similarly, the statistical analysis conducted on geographies consisting of 46,257,310 people shows a slight negative correlation between the proportion of Immigrants from the Azores and percentage of population with at least 3rd grade education in the United States with a correlation coefficient (R) of -0.061 and weighted average of 96.6%, a difference of 0.94%.
3rd Grade Correlation Summary
| Measurement | Immigrants from Sudan | Immigrants from the Azores |
| Minimum | 90.5% | 93.4% |
| Maximum | 100.0% | 100.0% |
| Range | 9.5% | 6.6% |
| Mean | 97.7% | 97.0% |
| Median | 97.7% | 97.1% |
| Interquartile 25% (IQ1) | 97.1% | 96.0% |
| Interquartile 75% (IQ3) | 99.1% | 98.2% |
| Interquartile Range (IQR) | 2.0% | 2.2% |
| Standard Deviation (Sample) | 1.8% | 1.6% |
| Standard Deviation (Population) | 1.8% | 1.6% |
Similar Demographics by 3rd Grade
Demographics Similar to Immigrants from Sudan by 3rd Grade
In terms of 3rd grade, the demographic groups most similar to Immigrants from Sudan are Subsaharan African (97.5%, a difference of 0.010%), Senegalese (97.5%, a difference of 0.010%), Immigrants from Syria (97.5%, a difference of 0.020%), Bahamian (97.5%, a difference of 0.020%), and Tongan (97.5%, a difference of 0.020%).
| Demographics | Rating | Rank | 3rd Grade |
| Immigrants | Morocco | 5.0 /100 | #220 | Tragic 97.5% |
| Uruguayans | 5.0 /100 | #221 | Tragic 97.5% |
| Sierra Leoneans | 4.6 /100 | #222 | Tragic 97.5% |
| Immigrants | Syria | 4.4 /100 | #223 | Tragic 97.5% |
| Bahamians | 4.4 /100 | #224 | Tragic 97.5% |
| Tongans | 4.3 /100 | #225 | Tragic 97.5% |
| Sudanese | 4.1 /100 | #226 | Tragic 97.5% |
| Immigrants | Sudan | 3.4 /100 | #227 | Tragic 97.5% |
| Sub-Saharan Africans | 3.2 /100 | #228 | Tragic 97.5% |
| Senegalese | 3.0 /100 | #229 | Tragic 97.5% |
| Immigrants | Pakistan | 2.7 /100 | #230 | Tragic 97.5% |
| Immigrants | Costa Rica | 2.7 /100 | #231 | Tragic 97.5% |
| Immigrants | Western Asia | 2.6 /100 | #232 | Tragic 97.5% |
| Immigrants | Malaysia | 2.4 /100 | #233 | Tragic 97.5% |
| Immigrants | Eastern Asia | 1.9 /100 | #234 | Tragic 97.4% |
Demographics Similar to Immigrants from the Azores by 3rd Grade
In terms of 3rd grade, the demographic groups most similar to Immigrants from the Azores are Immigrants from Ecuador (96.6%, a difference of 0.010%), Belizean (96.6%, a difference of 0.010%), Immigrants from Burma/Myanmar (96.6%, a difference of 0.010%), Immigrants from Laos (96.6%, a difference of 0.020%), and Immigrants from Bangladesh (96.6%, a difference of 0.030%).
| Demographics | Rating | Rank | 3rd Grade |
| Immigrants | Haiti | 0.0 /100 | #308 | Tragic 96.7% |
| Sri Lankans | 0.0 /100 | #309 | Tragic 96.7% |
| Cape Verdeans | 0.0 /100 | #310 | Tragic 96.6% |
| Immigrants | Guyana | 0.0 /100 | #311 | Tragic 96.6% |
| Immigrants | Laos | 0.0 /100 | #312 | Tragic 96.6% |
| Immigrants | Ecuador | 0.0 /100 | #313 | Tragic 96.6% |
| Belizeans | 0.0 /100 | #314 | Tragic 96.6% |
| Immigrants | Azores | 0.0 /100 | #315 | Tragic 96.6% |
| Immigrants | Burma/Myanmar | 0.0 /100 | #316 | Tragic 96.6% |
| Immigrants | Bangladesh | 0.0 /100 | #317 | Tragic 96.6% |
| Hispanics or Latinos | 0.0 /100 | #318 | Tragic 96.5% |
| Vietnamese | 0.0 /100 | #319 | Tragic 96.5% |
| Immigrants | Nicaragua | 0.0 /100 | #320 | Tragic 96.5% |
| Indonesians | 0.0 /100 | #321 | Tragic 96.5% |
| Immigrants | Belize | 0.0 /100 | #322 | Tragic 96.5% |