Immigrants from Switzerland vs Taiwanese 11th Grade
COMPARE
Immigrants from Switzerland
Taiwanese
11th Grade
11th Grade Comparison
Immigrants from Switzerland
Taiwanese
93.6%
11TH GRADE
99.3/ 100
METRIC RATING
85th/ 347
METRIC RANK
91.3%
11TH GRADE
0.6/ 100
METRIC RATING
261st/ 347
METRIC RANK
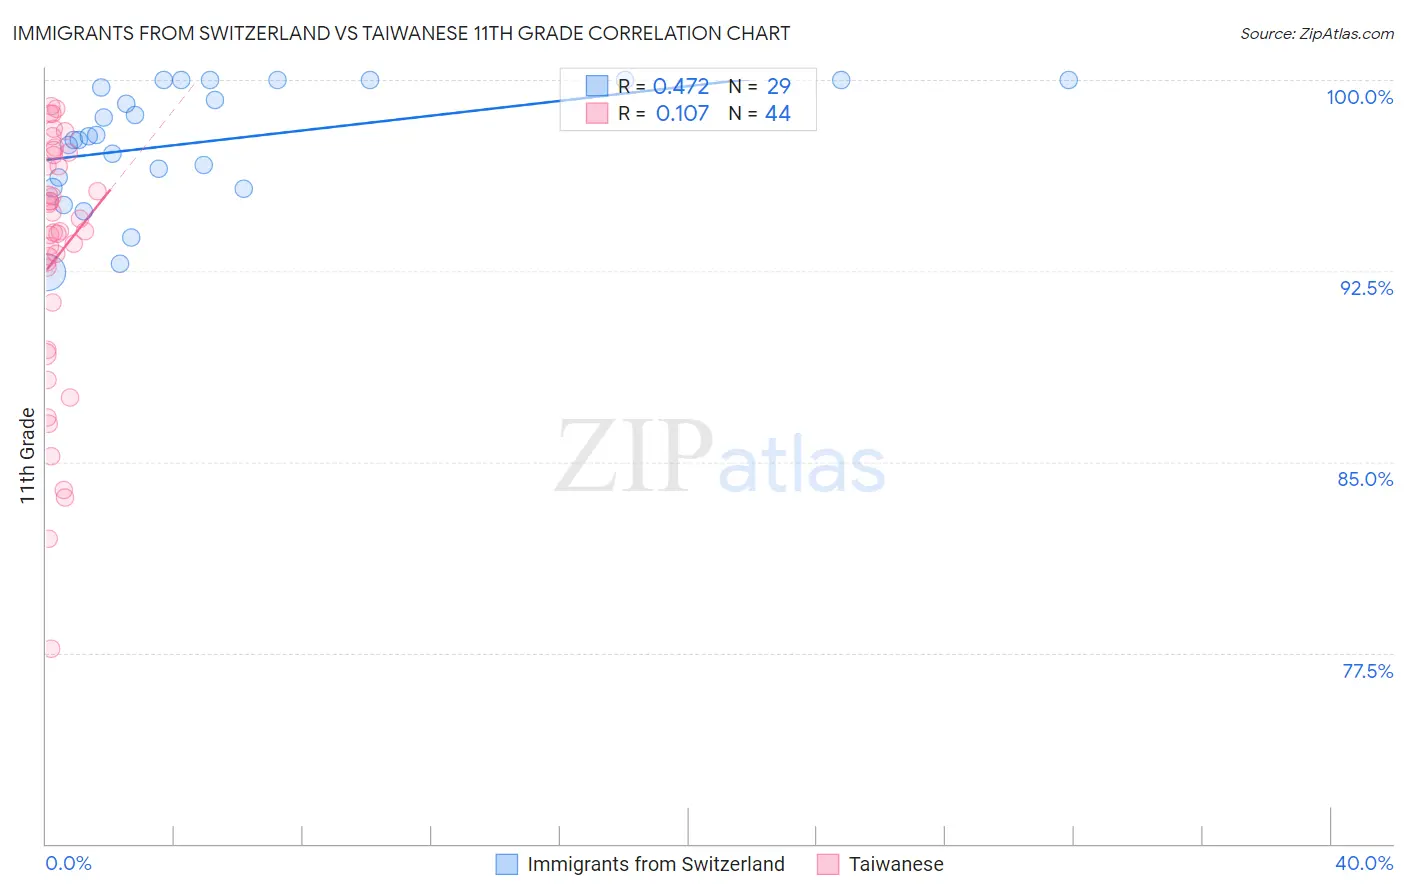
Immigrants from Switzerland vs Taiwanese 11th Grade Correlation Chart
The statistical analysis conducted on geographies consisting of 148,082,451 people shows a moderate positive correlation between the proportion of Immigrants from Switzerland and percentage of population with at least 11th grade education in the United States with a correlation coefficient (R) of 0.472 and weighted average of 93.6%. Similarly, the statistical analysis conducted on geographies consisting of 31,724,936 people shows a poor positive correlation between the proportion of Taiwanese and percentage of population with at least 11th grade education in the United States with a correlation coefficient (R) of 0.107 and weighted average of 91.3%, a difference of 2.5%.
11th Grade Correlation Summary
| Measurement | Immigrants from Switzerland | Taiwanese |
| Minimum | 92.4% | 77.7% |
| Maximum | 100.0% | 98.9% |
| Range | 7.6% | 21.3% |
| Mean | 97.6% | 93.0% |
| Median | 97.8% | 94.0% |
| Interquartile 25% (IQ1) | 96.0% | 90.3% |
| Interquartile 75% (IQ3) | 100.0% | 96.8% |
| Interquartile Range (IQR) | 4.0% | 6.5% |
| Standard Deviation (Sample) | 2.3% | 5.1% |
| Standard Deviation (Population) | 2.2% | 5.0% |
Similar Demographics by 11th Grade
Demographics Similar to Immigrants from Switzerland by 11th Grade
In terms of 11th grade, the demographic groups most similar to Immigrants from Switzerland are Immigrants from Taiwan (93.6%, a difference of 0.0%), Icelander (93.6%, a difference of 0.010%), Immigrants from South Central Asia (93.6%, a difference of 0.010%), Immigrants from Western Europe (93.6%, a difference of 0.010%), and Cambodian (93.6%, a difference of 0.010%).
| Demographics | Rating | Rank | 11th Grade |
| Soviet Union | 99.5 /100 | #78 | Exceptional 93.7% |
| Immigrants | Denmark | 99.5 /100 | #79 | Exceptional 93.7% |
| Canadians | 99.5 /100 | #80 | Exceptional 93.7% |
| Immigrants | Moldova | 99.5 /100 | #81 | Exceptional 93.7% |
| Immigrants | Saudi Arabia | 99.3 /100 | #82 | Exceptional 93.7% |
| Icelanders | 99.3 /100 | #83 | Exceptional 93.6% |
| Immigrants | Taiwan | 99.3 /100 | #84 | Exceptional 93.6% |
| Immigrants | Switzerland | 99.3 /100 | #85 | Exceptional 93.6% |
| Immigrants | South Central Asia | 99.2 /100 | #86 | Exceptional 93.6% |
| Immigrants | Western Europe | 99.2 /100 | #87 | Exceptional 93.6% |
| Cambodians | 99.2 /100 | #88 | Exceptional 93.6% |
| Burmese | 99.2 /100 | #89 | Exceptional 93.6% |
| Ottawa | 99.2 /100 | #90 | Exceptional 93.6% |
| South Africans | 99.2 /100 | #91 | Exceptional 93.6% |
| Immigrants | Bulgaria | 99.1 /100 | #92 | Exceptional 93.6% |
Demographics Similar to Taiwanese by 11th Grade
In terms of 11th grade, the demographic groups most similar to Taiwanese are Jamaican (91.4%, a difference of 0.010%), Spanish American (91.4%, a difference of 0.010%), Immigrants from Uruguay (91.3%, a difference of 0.010%), Immigrants from Colombia (91.4%, a difference of 0.030%), and Immigrants from Senegal (91.4%, a difference of 0.050%).
| Demographics | Rating | Rank | 11th Grade |
| Immigrants | Eritrea | 0.7 /100 | #254 | Tragic 91.4% |
| Blacks/African Americans | 0.7 /100 | #255 | Tragic 91.4% |
| Immigrants | Senegal | 0.7 /100 | #256 | Tragic 91.4% |
| Cajuns | 0.7 /100 | #257 | Tragic 91.4% |
| Immigrants | Colombia | 0.6 /100 | #258 | Tragic 91.4% |
| Jamaicans | 0.6 /100 | #259 | Tragic 91.4% |
| Spanish Americans | 0.6 /100 | #260 | Tragic 91.4% |
| Taiwanese | 0.6 /100 | #261 | Tragic 91.3% |
| Immigrants | Uruguay | 0.5 /100 | #262 | Tragic 91.3% |
| Immigrants | Ghana | 0.3 /100 | #263 | Tragic 91.2% |
| Yup'ik | 0.3 /100 | #264 | Tragic 91.2% |
| Pueblo | 0.3 /100 | #265 | Tragic 91.2% |
| Immigrants | Western Africa | 0.3 /100 | #266 | Tragic 91.2% |
| Immigrants | Jamaica | 0.3 /100 | #267 | Tragic 91.2% |
| U.S. Virgin Islanders | 0.2 /100 | #268 | Tragic 91.1% |