Immigrants from Turkey vs Lumbee 7th Grade
COMPARE
Immigrants from Turkey
Lumbee
7th Grade
7th Grade Comparison
Immigrants from Turkey
Lumbee
96.4%
7TH GRADE
90.2/ 100
METRIC RATING
137th/ 347
METRIC RANK
96.6%
7TH GRADE
97.8/ 100
METRIC RATING
107th/ 347
METRIC RANK
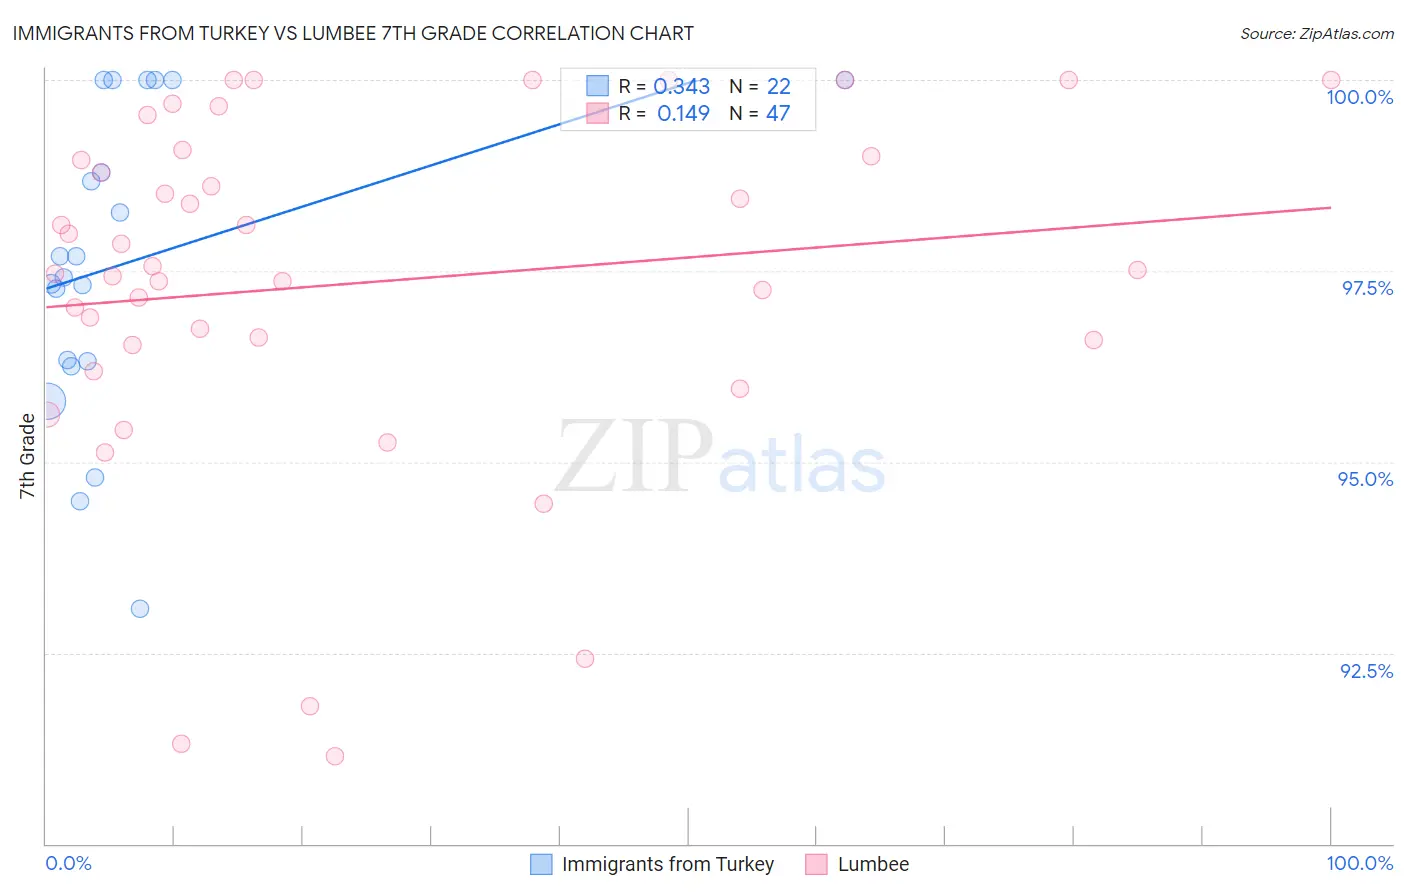
Immigrants from Turkey vs Lumbee 7th Grade Correlation Chart
The statistical analysis conducted on geographies consisting of 223,057,877 people shows a mild positive correlation between the proportion of Immigrants from Turkey and percentage of population with at least 7th grade education in the United States with a correlation coefficient (R) of 0.343 and weighted average of 96.4%. Similarly, the statistical analysis conducted on geographies consisting of 92,299,110 people shows a poor positive correlation between the proportion of Lumbee and percentage of population with at least 7th grade education in the United States with a correlation coefficient (R) of 0.149 and weighted average of 96.6%, a difference of 0.24%.
7th Grade Correlation Summary
| Measurement | Immigrants from Turkey | Lumbee |
| Minimum | 93.1% | 91.1% |
| Maximum | 100.0% | 100.0% |
| Range | 6.9% | 8.9% |
| Mean | 97.6% | 97.3% |
| Median | 97.6% | 97.5% |
| Interquartile 25% (IQ1) | 96.3% | 96.5% |
| Interquartile 75% (IQ3) | 100.0% | 99.0% |
| Interquartile Range (IQR) | 3.7% | 2.5% |
| Standard Deviation (Sample) | 2.0% | 2.3% |
| Standard Deviation (Population) | 2.0% | 2.3% |
Similar Demographics by 7th Grade
Demographics Similar to Immigrants from Turkey by 7th Grade
In terms of 7th grade, the demographic groups most similar to Immigrants from Turkey are Jordanian (96.4%, a difference of 0.0%), Immigrants from Hungary (96.4%, a difference of 0.010%), Hmong (96.4%, a difference of 0.020%), Soviet Union (96.4%, a difference of 0.020%), and Immigrants from Kuwait (96.4%, a difference of 0.020%).
| Demographics | Rating | Rank | 7th Grade |
| Immigrants | Serbia | 92.8 /100 | #130 | Exceptional 96.4% |
| Filipinos | 92.1 /100 | #131 | Exceptional 96.4% |
| Colville | 91.7 /100 | #132 | Exceptional 96.4% |
| Hmong | 91.5 /100 | #133 | Exceptional 96.4% |
| Soviet Union | 91.2 /100 | #134 | Exceptional 96.4% |
| Immigrants | Kuwait | 91.1 /100 | #135 | Exceptional 96.4% |
| Immigrants | Hungary | 90.6 /100 | #136 | Exceptional 96.4% |
| Immigrants | Turkey | 90.2 /100 | #137 | Exceptional 96.4% |
| Jordanians | 90.0 /100 | #138 | Excellent 96.4% |
| Basques | 89.3 /100 | #139 | Excellent 96.4% |
| Cambodians | 88.3 /100 | #140 | Excellent 96.3% |
| Immigrants | South Central Asia | 87.1 /100 | #141 | Excellent 96.3% |
| Burmese | 87.1 /100 | #142 | Excellent 96.3% |
| Spanish | 86.6 /100 | #143 | Excellent 96.3% |
| Immigrants | Greece | 85.9 /100 | #144 | Excellent 96.3% |
Demographics Similar to Lumbee by 7th Grade
In terms of 7th grade, the demographic groups most similar to Lumbee are Immigrants from Saudi Arabia (96.6%, a difference of 0.0%), Iroquois (96.6%, a difference of 0.010%), Bhutanese (96.6%, a difference of 0.010%), Shoshone (96.6%, a difference of 0.020%), and South African (96.6%, a difference of 0.020%).
| Demographics | Rating | Rank | 7th Grade |
| German Russians | 98.6 /100 | #100 | Exceptional 96.7% |
| Thais | 98.6 /100 | #101 | Exceptional 96.7% |
| Immigrants | Czechoslovakia | 98.3 /100 | #102 | Exceptional 96.6% |
| Immigrants | Singapore | 98.3 /100 | #103 | Exceptional 96.6% |
| Shoshone | 98.1 /100 | #104 | Exceptional 96.6% |
| South Africans | 98.0 /100 | #105 | Exceptional 96.6% |
| Iroquois | 97.9 /100 | #106 | Exceptional 96.6% |
| Lumbee | 97.8 /100 | #107 | Exceptional 96.6% |
| Immigrants | Saudi Arabia | 97.8 /100 | #108 | Exceptional 96.6% |
| Bhutanese | 97.7 /100 | #109 | Exceptional 96.6% |
| Okinawans | 97.4 /100 | #110 | Exceptional 96.6% |
| Immigrants | Latvia | 97.4 /100 | #111 | Exceptional 96.6% |
| Immigrants | Nonimmigrants | 97.0 /100 | #112 | Exceptional 96.5% |
| Pueblo | 96.8 /100 | #113 | Exceptional 96.5% |
| Immigrants | Zimbabwe | 96.6 /100 | #114 | Exceptional 96.5% |