Immigrants from Western Africa vs Peruvian Master's Degree
COMPARE
Immigrants from Western Africa
Peruvian
Master's Degree
Master's Degree Comparison
Immigrants from Western Africa
Peruvians
14.4%
MASTER'S DEGREE
24.9/ 100
METRIC RATING
202nd/ 347
METRIC RANK
15.3%
MASTER'S DEGREE
68.7/ 100
METRIC RATING
162nd/ 347
METRIC RANK
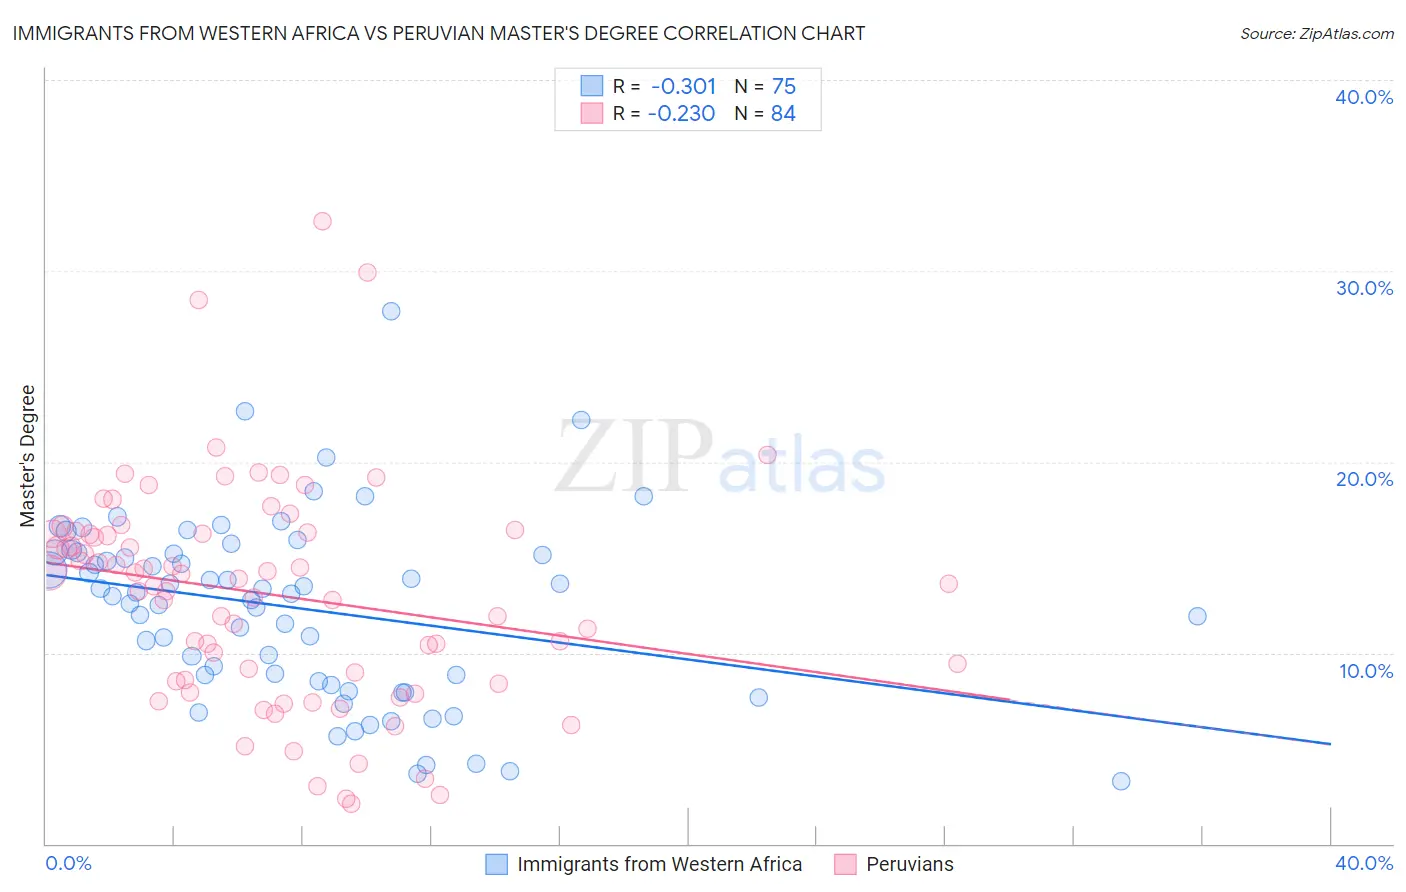
Immigrants from Western Africa vs Peruvian Master's Degree Correlation Chart
The statistical analysis conducted on geographies consisting of 357,742,220 people shows a mild negative correlation between the proportion of Immigrants from Western Africa and percentage of population with at least master's degree education in the United States with a correlation coefficient (R) of -0.301 and weighted average of 14.4%. Similarly, the statistical analysis conducted on geographies consisting of 363,142,286 people shows a weak negative correlation between the proportion of Peruvians and percentage of population with at least master's degree education in the United States with a correlation coefficient (R) of -0.230 and weighted average of 15.3%, a difference of 6.3%.
Master's Degree Correlation Summary
| Measurement | Immigrants from Western Africa | Peruvian |
| Minimum | 3.3% | 2.1% |
| Maximum | 27.9% | 32.6% |
| Range | 24.6% | 30.5% |
| Mean | 12.4% | 13.1% |
| Median | 13.1% | 13.8% |
| Interquartile 25% (IQ1) | 8.5% | 8.6% |
| Interquartile 75% (IQ3) | 15.3% | 16.3% |
| Interquartile Range (IQR) | 6.8% | 7.7% |
| Standard Deviation (Sample) | 4.8% | 5.8% |
| Standard Deviation (Population) | 4.7% | 5.8% |
Similar Demographics by Master's Degree
Demographics Similar to Immigrants from Western Africa by Master's Degree
In terms of master's degree, the demographic groups most similar to Immigrants from Western Africa are Scotch-Irish (14.4%, a difference of 0.010%), Panamanian (14.4%, a difference of 0.020%), Yugoslavian (14.4%, a difference of 0.11%), French (14.4%, a difference of 0.22%), and Trinidadian and Tobagonian (14.4%, a difference of 0.26%).
| Demographics | Rating | Rank | Master's Degree |
| Danes | 31.3 /100 | #195 | Fair 14.5% |
| Czechoslovakians | 29.9 /100 | #196 | Fair 14.5% |
| Belgians | 28.0 /100 | #197 | Fair 14.5% |
| West Indians | 27.4 /100 | #198 | Fair 14.5% |
| Immigrants | Armenia | 27.2 /100 | #199 | Fair 14.5% |
| Panamanians | 25.1 /100 | #200 | Fair 14.4% |
| Scotch-Irish | 25.0 /100 | #201 | Fair 14.4% |
| Immigrants | Western Africa | 24.9 /100 | #202 | Fair 14.4% |
| Yugoslavians | 24.3 /100 | #203 | Fair 14.4% |
| French | 23.7 /100 | #204 | Fair 14.4% |
| Trinidadians and Tobagonians | 23.5 /100 | #205 | Fair 14.4% |
| Scandinavians | 23.3 /100 | #206 | Fair 14.4% |
| Immigrants | Bosnia and Herzegovina | 22.0 /100 | #207 | Fair 14.3% |
| Immigrants | Barbados | 20.5 /100 | #208 | Fair 14.3% |
| Immigrants | Panama | 20.0 /100 | #209 | Fair 14.3% |
Demographics Similar to Peruvians by Master's Degree
In terms of master's degree, the demographic groups most similar to Peruvians are Sudanese (15.3%, a difference of 0.010%), Uruguayan (15.3%, a difference of 0.22%), Kenyan (15.3%, a difference of 0.24%), Colombian (15.3%, a difference of 0.25%), and Immigrants from Kenya (15.3%, a difference of 0.29%).
| Demographics | Rating | Rank | Master's Degree |
| Immigrants | Bangladesh | 76.1 /100 | #155 | Good 15.5% |
| Bermudans | 73.9 /100 | #156 | Good 15.4% |
| Immigrants | Cameroon | 71.7 /100 | #157 | Good 15.4% |
| Immigrants | Poland | 71.5 /100 | #158 | Good 15.4% |
| Luxembourgers | 71.0 /100 | #159 | Good 15.3% |
| Kenyans | 70.3 /100 | #160 | Good 15.3% |
| Sudanese | 68.7 /100 | #161 | Good 15.3% |
| Peruvians | 68.7 /100 | #162 | Good 15.3% |
| Uruguayans | 67.1 /100 | #163 | Good 15.3% |
| Colombians | 66.9 /100 | #164 | Good 15.3% |
| Immigrants | Kenya | 66.6 /100 | #165 | Good 15.3% |
| Swedes | 66.1 /100 | #166 | Good 15.2% |
| Senegalese | 65.6 /100 | #167 | Good 15.2% |
| Immigrants | North Macedonia | 64.5 /100 | #168 | Good 15.2% |
| Scottish | 62.7 /100 | #169 | Good 15.2% |