Immigrants from Yemen vs Immigrants from Asia 7th Grade
COMPARE
Immigrants from Yemen
Immigrants from Asia
7th Grade
7th Grade Comparison
Immigrants from Yemen
Immigrants from Asia
92.6%
7TH GRADE
0.0/ 100
METRIC RATING
334th/ 347
METRIC RANK
95.5%
7TH GRADE
2.3/ 100
METRIC RATING
237th/ 347
METRIC RANK
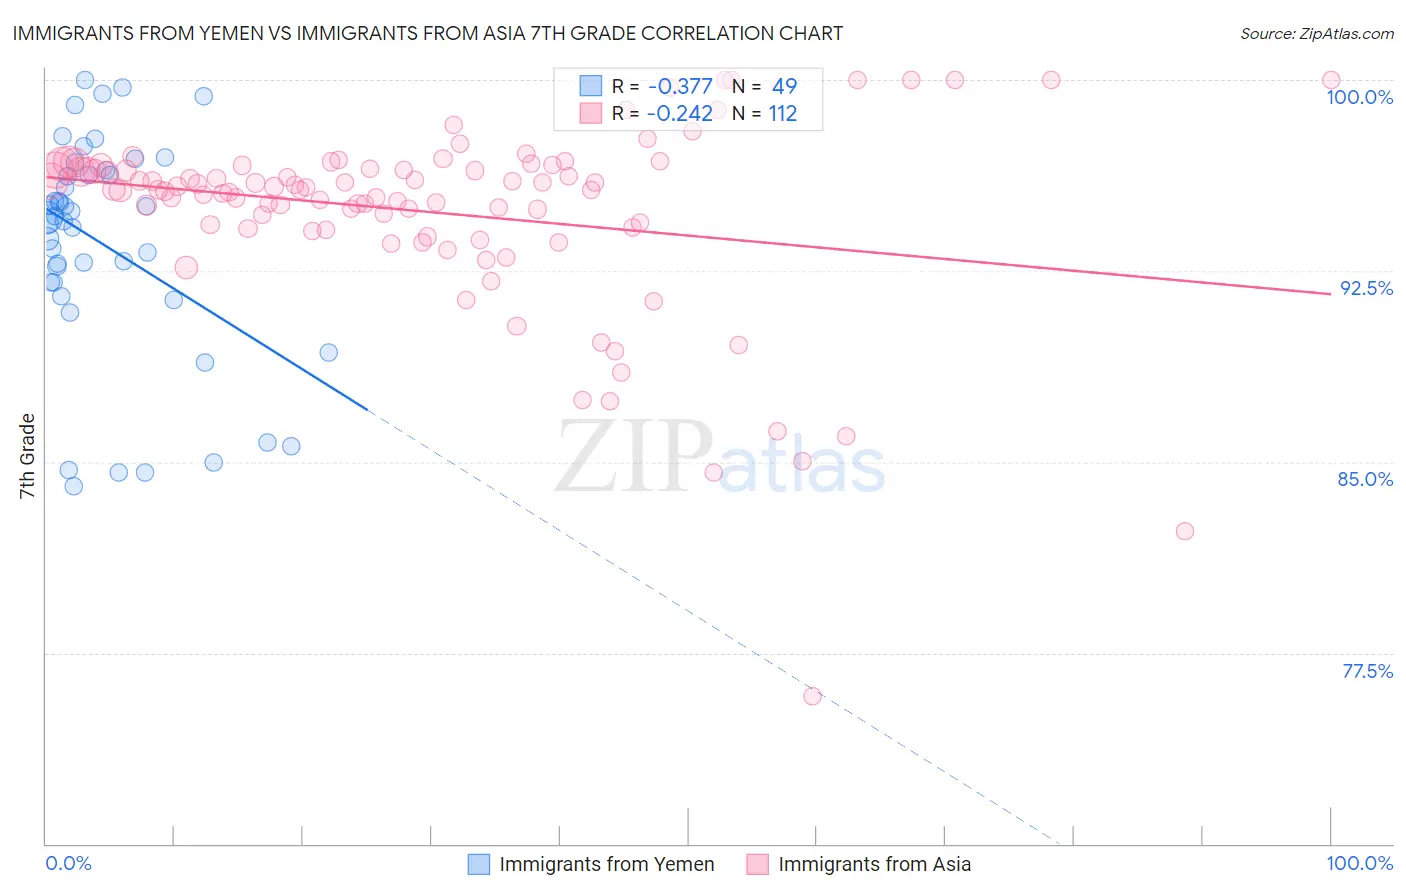
Immigrants from Yemen vs Immigrants from Asia 7th Grade Correlation Chart
The statistical analysis conducted on geographies consisting of 82,429,885 people shows a mild negative correlation between the proportion of Immigrants from Yemen and percentage of population with at least 7th grade education in the United States with a correlation coefficient (R) of -0.377 and weighted average of 92.6%. Similarly, the statistical analysis conducted on geographies consisting of 549,167,442 people shows a weak negative correlation between the proportion of Immigrants from Asia and percentage of population with at least 7th grade education in the United States with a correlation coefficient (R) of -0.242 and weighted average of 95.5%, a difference of 3.1%.
7th Grade Correlation Summary
| Measurement | Immigrants from Yemen | Immigrants from Asia |
| Minimum | 84.0% | 75.8% |
| Maximum | 100.0% | 100.0% |
| Range | 16.0% | 24.2% |
| Mean | 93.5% | 94.8% |
| Median | 94.6% | 95.7% |
| Interquartile 25% (IQ1) | 91.8% | 94.2% |
| Interquartile 75% (IQ3) | 96.4% | 96.6% |
| Interquartile Range (IQR) | 4.6% | 2.4% |
| Standard Deviation (Sample) | 4.3% | 3.8% |
| Standard Deviation (Population) | 4.3% | 3.7% |
Similar Demographics by 7th Grade
Demographics Similar to Immigrants from Yemen by 7th Grade
In terms of 7th grade, the demographic groups most similar to Immigrants from Yemen are Immigrants from Armenia (92.7%, a difference of 0.080%), Hispanic or Latino (92.7%, a difference of 0.10%), Mexican American Indian (92.6%, a difference of 0.10%), Immigrants from Honduras (92.5%, a difference of 0.17%), and Honduran (92.9%, a difference of 0.24%).
| Demographics | Rating | Rank | 7th Grade |
| Immigrants | Cabo Verde | 0.0 /100 | #327 | Tragic 93.1% |
| Immigrants | Nicaragua | 0.0 /100 | #328 | Tragic 93.0% |
| Immigrants | Azores | 0.0 /100 | #329 | Tragic 93.0% |
| Immigrants | Dominican Republic | 0.0 /100 | #330 | Tragic 92.9% |
| Hondurans | 0.0 /100 | #331 | Tragic 92.9% |
| Hispanics or Latinos | 0.0 /100 | #332 | Tragic 92.7% |
| Immigrants | Armenia | 0.0 /100 | #333 | Tragic 92.7% |
| Immigrants | Yemen | 0.0 /100 | #334 | Tragic 92.6% |
| Mexican American Indians | 0.0 /100 | #335 | Tragic 92.6% |
| Immigrants | Honduras | 0.0 /100 | #336 | Tragic 92.5% |
| Immigrants | Latin America | 0.0 /100 | #337 | Tragic 92.2% |
| Central Americans | 0.0 /100 | #338 | Tragic 92.1% |
| Mexicans | 0.0 /100 | #339 | Tragic 91.9% |
| Yakama | 0.0 /100 | #340 | Tragic 91.7% |
| Guatemalans | 0.0 /100 | #341 | Tragic 91.7% |
Demographics Similar to Immigrants from Asia by 7th Grade
In terms of 7th grade, the demographic groups most similar to Immigrants from Asia are Indian (Asian) (95.5%, a difference of 0.0%), Asian (95.5%, a difference of 0.010%), Jamaican (95.5%, a difference of 0.010%), Immigrants from Africa (95.5%, a difference of 0.020%), and Immigrants from Sierra Leone (95.5%, a difference of 0.030%).
| Demographics | Rating | Rank | 7th Grade |
| Natives/Alaskans | 4.2 /100 | #230 | Tragic 95.6% |
| Senegalese | 4.0 /100 | #231 | Tragic 95.6% |
| Costa Ricans | 3.3 /100 | #232 | Tragic 95.5% |
| Immigrants | Indonesia | 3.3 /100 | #233 | Tragic 95.5% |
| Nigerians | 3.0 /100 | #234 | Tragic 95.5% |
| Immigrants | Africa | 2.7 /100 | #235 | Tragic 95.5% |
| Asians | 2.6 /100 | #236 | Tragic 95.5% |
| Immigrants | Asia | 2.3 /100 | #237 | Tragic 95.5% |
| Indians (Asian) | 2.3 /100 | #238 | Tragic 95.5% |
| Jamaicans | 2.2 /100 | #239 | Tragic 95.5% |
| Immigrants | Sierra Leone | 2.0 /100 | #240 | Tragic 95.5% |
| South American Indians | 2.0 /100 | #241 | Tragic 95.5% |
| Immigrants | Senegal | 1.9 /100 | #242 | Tragic 95.5% |
| U.S. Virgin Islanders | 1.6 /100 | #243 | Tragic 95.4% |
| Uruguayans | 1.6 /100 | #244 | Tragic 95.4% |