Immigrants from Yemen vs Israeli High School Diploma
COMPARE
Immigrants from Yemen
Israeli
High School Diploma
High School Diploma Comparison
Immigrants from Yemen
Israelis
81.8%
HIGH SCHOOL DIPLOMA
0.0/ 100
METRIC RATING
337th/ 347
METRIC RANK
90.1%
HIGH SCHOOL DIPLOMA
95.1/ 100
METRIC RATING
118th/ 347
METRIC RANK
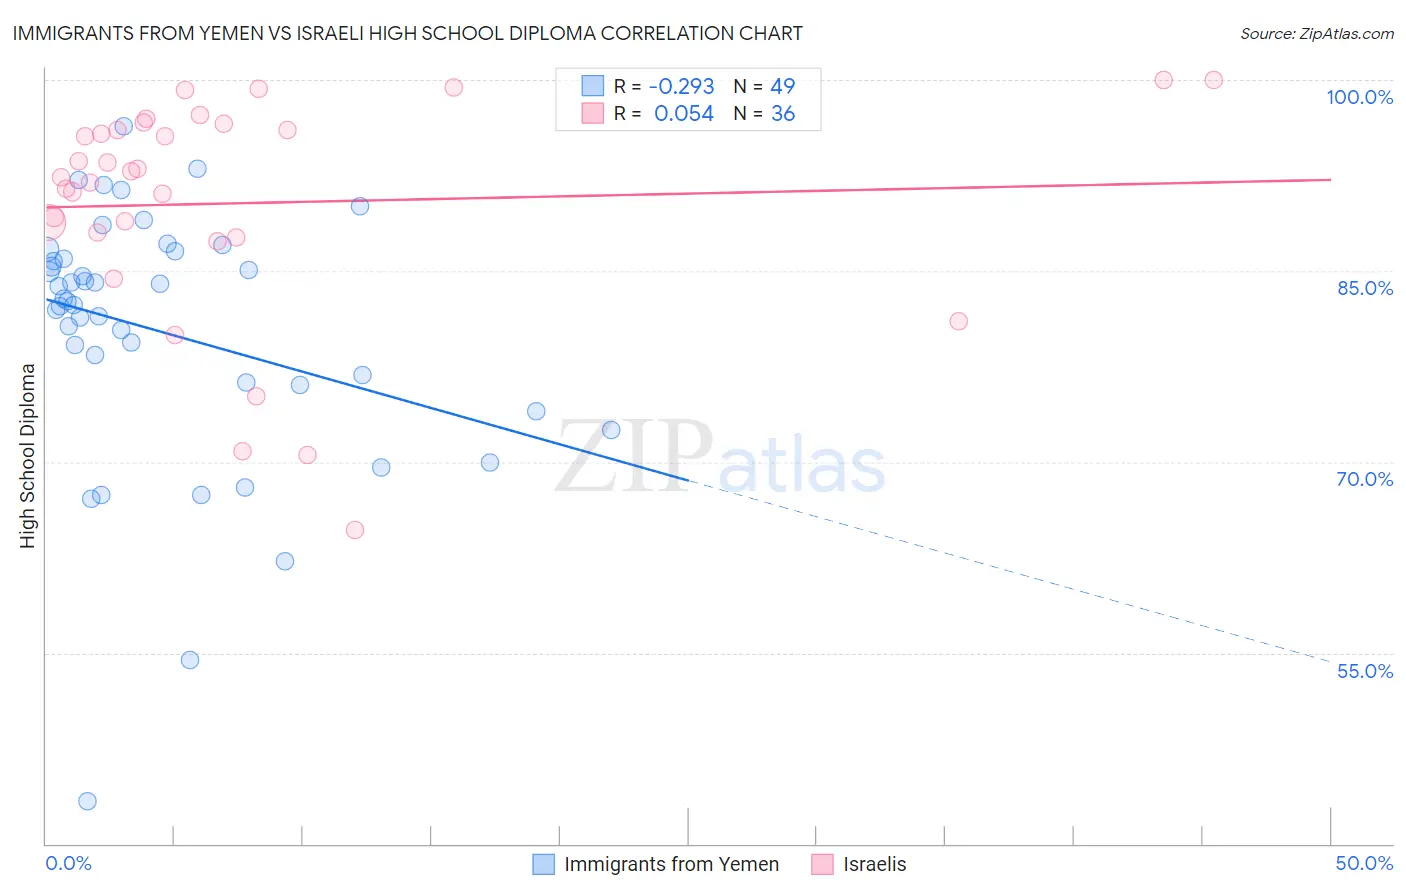
Immigrants from Yemen vs Israeli High School Diploma Correlation Chart
The statistical analysis conducted on geographies consisting of 82,429,885 people shows a weak negative correlation between the proportion of Immigrants from Yemen and percentage of population with at least high school diploma education in the United States with a correlation coefficient (R) of -0.293 and weighted average of 81.8%. Similarly, the statistical analysis conducted on geographies consisting of 211,220,500 people shows a slight positive correlation between the proportion of Israelis and percentage of population with at least high school diploma education in the United States with a correlation coefficient (R) of 0.054 and weighted average of 90.1%, a difference of 10.2%.
High School Diploma Correlation Summary
| Measurement | Immigrants from Yemen | Israeli |
| Minimum | 43.3% | 64.7% |
| Maximum | 96.4% | 100.0% |
| Range | 53.1% | 35.3% |
| Mean | 80.2% | 90.3% |
| Median | 82.6% | 92.6% |
| Interquartile 25% (IQ1) | 76.1% | 87.8% |
| Interquartile 75% (IQ3) | 86.2% | 96.3% |
| Interquartile Range (IQR) | 10.1% | 8.5% |
| Standard Deviation (Sample) | 10.1% | 8.8% |
| Standard Deviation (Population) | 10.0% | 8.7% |
Similar Demographics by High School Diploma
Demographics Similar to Immigrants from Yemen by High School Diploma
In terms of high school diploma, the demographic groups most similar to Immigrants from Yemen are Guatemalan (82.0%, a difference of 0.15%), Immigrants from Dominican Republic (82.0%, a difference of 0.15%), Salvadoran (81.7%, a difference of 0.17%), Tohono O'odham (82.1%, a difference of 0.27%), and Pima (81.6%, a difference of 0.27%).
| Demographics | Rating | Rank | High School Diploma |
| Immigrants | Azores | 0.0 /100 | #330 | Tragic 82.8% |
| Central Americans | 0.0 /100 | #331 | Tragic 82.5% |
| Immigrants | Honduras | 0.0 /100 | #332 | Tragic 82.5% |
| Immigrants | Latin America | 0.0 /100 | #333 | Tragic 82.1% |
| Tohono O'odham | 0.0 /100 | #334 | Tragic 82.1% |
| Guatemalans | 0.0 /100 | #335 | Tragic 82.0% |
| Immigrants | Dominican Republic | 0.0 /100 | #336 | Tragic 82.0% |
| Immigrants | Yemen | 0.0 /100 | #337 | Tragic 81.8% |
| Salvadorans | 0.0 /100 | #338 | Tragic 81.7% |
| Pima | 0.0 /100 | #339 | Tragic 81.6% |
| Houma | 0.0 /100 | #340 | Tragic 81.5% |
| Mexicans | 0.0 /100 | #341 | Tragic 81.4% |
| Immigrants | Guatemala | 0.0 /100 | #342 | Tragic 81.4% |
| Immigrants | El Salvador | 0.0 /100 | #343 | Tragic 80.8% |
| Immigrants | Central America | 0.0 /100 | #344 | Tragic 80.1% |
Demographics Similar to Israelis by High School Diploma
In terms of high school diploma, the demographic groups most similar to Israelis are Jordanian (90.2%, a difference of 0.020%), Immigrants from Eastern Europe (90.1%, a difference of 0.020%), Immigrants from Germany (90.2%, a difference of 0.050%), Ottawa (90.1%, a difference of 0.050%), and Immigrants from Hungary (90.2%, a difference of 0.060%).
| Demographics | Rating | Rank | High School Diploma |
| Menominee | 96.6 /100 | #111 | Exceptional 90.3% |
| Immigrants | Belarus | 96.4 /100 | #112 | Exceptional 90.2% |
| Immigrants | Sri Lanka | 96.3 /100 | #113 | Exceptional 90.2% |
| Yugoslavians | 96.2 /100 | #114 | Exceptional 90.2% |
| Immigrants | Hungary | 95.8 /100 | #115 | Exceptional 90.2% |
| Immigrants | Germany | 95.7 /100 | #116 | Exceptional 90.2% |
| Jordanians | 95.4 /100 | #117 | Exceptional 90.2% |
| Israelis | 95.1 /100 | #118 | Exceptional 90.1% |
| Immigrants | Eastern Europe | 94.9 /100 | #119 | Exceptional 90.1% |
| Ottawa | 94.4 /100 | #120 | Exceptional 90.1% |
| Whites/Caucasians | 94.1 /100 | #121 | Exceptional 90.1% |
| Immigrants | Kazakhstan | 93.4 /100 | #122 | Exceptional 90.0% |
| German Russians | 92.0 /100 | #123 | Exceptional 90.0% |
| Mongolians | 91.6 /100 | #124 | Exceptional 89.9% |
| Egyptians | 91.1 /100 | #125 | Exceptional 89.9% |