Indian (Asian) vs Immigrants from Netherlands Master's Degree
COMPARE
Indian (Asian)
Immigrants from Netherlands
Master's Degree
Master's Degree Comparison
Indians (Asian)
Immigrants from Netherlands
20.5%
MASTER'S DEGREE
100.0/ 100
METRIC RATING
20th/ 347
METRIC RANK
18.1%
MASTER'S DEGREE
99.9/ 100
METRIC RATING
63rd/ 347
METRIC RANK
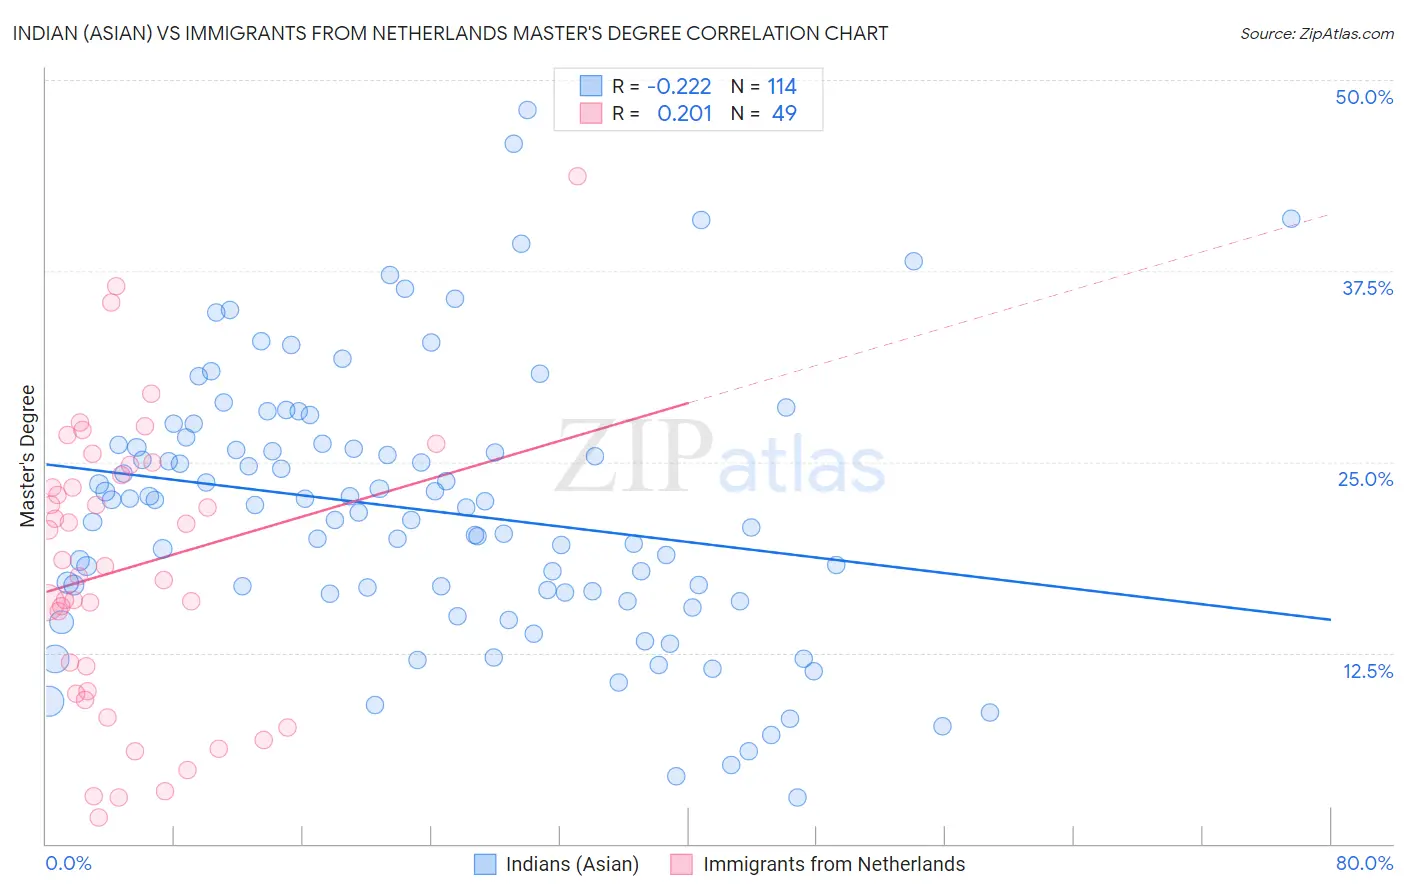
Indian (Asian) vs Immigrants from Netherlands Master's Degree Correlation Chart
The statistical analysis conducted on geographies consisting of 495,020,045 people shows a weak negative correlation between the proportion of Indians (Asian) and percentage of population with at least master's degree education in the United States with a correlation coefficient (R) of -0.222 and weighted average of 20.5%. Similarly, the statistical analysis conducted on geographies consisting of 237,861,221 people shows a weak positive correlation between the proportion of Immigrants from Netherlands and percentage of population with at least master's degree education in the United States with a correlation coefficient (R) of 0.201 and weighted average of 18.1%, a difference of 12.9%.
Master's Degree Correlation Summary
| Measurement | Indian (Asian) | Immigrants from Netherlands |
| Minimum | 3.0% | 1.7% |
| Maximum | 48.0% | 43.7% |
| Range | 45.0% | 41.9% |
| Mean | 21.8% | 18.1% |
| Median | 22.1% | 18.2% |
| Interquartile 25% (IQ1) | 16.5% | 9.9% |
| Interquartile 75% (IQ3) | 26.1% | 24.5% |
| Interquartile Range (IQR) | 9.6% | 14.6% |
| Standard Deviation (Sample) | 8.8% | 9.4% |
| Standard Deviation (Population) | 8.8% | 9.3% |
Similar Demographics by Master's Degree
Demographics Similar to Indians (Asian) by Master's Degree
In terms of master's degree, the demographic groups most similar to Indians (Asian) are Immigrants from Hong Kong (20.5%, a difference of 0.020%), Immigrants from Ireland (20.4%, a difference of 0.11%), Soviet Union (20.5%, a difference of 0.37%), Israeli (20.3%, a difference of 0.53%), and Immigrants from France (20.3%, a difference of 0.81%).
| Demographics | Rating | Rank | Master's Degree |
| Immigrants | Australia | 100.0 /100 | #13 | Exceptional 20.9% |
| Immigrants | Switzerland | 100.0 /100 | #14 | Exceptional 20.9% |
| Immigrants | Eastern Asia | 100.0 /100 | #15 | Exceptional 20.8% |
| Immigrants | Belgium | 100.0 /100 | #16 | Exceptional 20.8% |
| Immigrants | South Central Asia | 100.0 /100 | #17 | Exceptional 20.7% |
| Soviet Union | 100.0 /100 | #18 | Exceptional 20.5% |
| Immigrants | Hong Kong | 100.0 /100 | #19 | Exceptional 20.5% |
| Indians (Asian) | 100.0 /100 | #20 | Exceptional 20.5% |
| Immigrants | Ireland | 100.0 /100 | #21 | Exceptional 20.4% |
| Israelis | 100.0 /100 | #22 | Exceptional 20.3% |
| Immigrants | France | 100.0 /100 | #23 | Exceptional 20.3% |
| Immigrants | Sweden | 100.0 /100 | #24 | Exceptional 20.3% |
| Immigrants | Japan | 100.0 /100 | #25 | Exceptional 20.0% |
| Cambodians | 100.0 /100 | #26 | Exceptional 20.0% |
| Immigrants | Sri Lanka | 100.0 /100 | #27 | Exceptional 19.9% |
Demographics Similar to Immigrants from Netherlands by Master's Degree
In terms of master's degree, the demographic groups most similar to Immigrants from Netherlands are South African (18.1%, a difference of 0.080%), Argentinean (18.2%, a difference of 0.36%), Immigrants from Europe (18.2%, a difference of 0.72%), Immigrants from Kazakhstan (18.0%, a difference of 0.78%), and Ethiopian (18.0%, a difference of 0.80%).
| Demographics | Rating | Rank | Master's Degree |
| Asians | 99.9 /100 | #56 | Exceptional 18.4% |
| Immigrants | Asia | 99.9 /100 | #57 | Exceptional 18.4% |
| Australians | 99.9 /100 | #58 | Exceptional 18.4% |
| Immigrants | Bulgaria | 99.9 /100 | #59 | Exceptional 18.3% |
| New Zealanders | 99.9 /100 | #60 | Exceptional 18.3% |
| Immigrants | Europe | 99.9 /100 | #61 | Exceptional 18.2% |
| Argentineans | 99.9 /100 | #62 | Exceptional 18.2% |
| Immigrants | Netherlands | 99.9 /100 | #63 | Exceptional 18.1% |
| South Africans | 99.9 /100 | #64 | Exceptional 18.1% |
| Immigrants | Kazakhstan | 99.8 /100 | #65 | Exceptional 18.0% |
| Ethiopians | 99.8 /100 | #66 | Exceptional 18.0% |
| Immigrants | Argentina | 99.8 /100 | #67 | Exceptional 18.0% |
| Immigrants | Ethiopia | 99.8 /100 | #68 | Exceptional 17.9% |
| Immigrants | Uzbekistan | 99.8 /100 | #69 | Exceptional 17.9% |
| Immigrants | Western Europe | 99.8 /100 | #70 | Exceptional 17.8% |