Japanese vs Black/African American GED/Equivalency
COMPARE
Japanese
Black/African American
GED/Equivalency
GED/Equivalency Comparison
Japanese
Blacks/African Americans
82.4%
GED/EQUIVALENCY
0.0/ 100
METRIC RATING
287th/ 347
METRIC RANK
82.8%
GED/EQUIVALENCY
0.1/ 100
METRIC RATING
276th/ 347
METRIC RANK
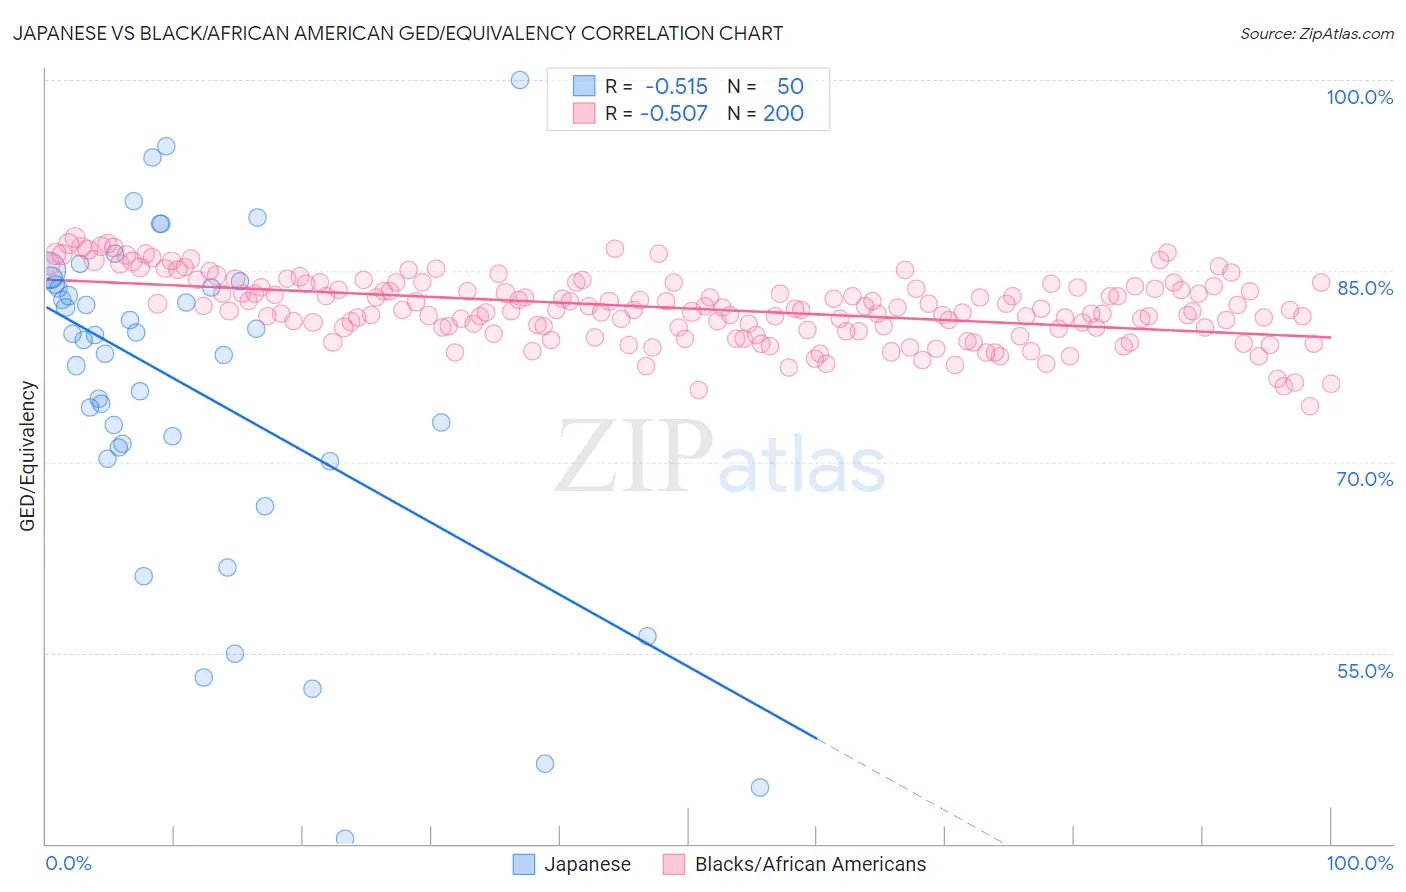
Japanese vs Black/African American GED/Equivalency Correlation Chart
The statistical analysis conducted on geographies consisting of 249,183,224 people shows a substantial negative correlation between the proportion of Japanese and percentage of population with at least ged/equivalency education in the United States with a correlation coefficient (R) of -0.515 and weighted average of 82.4%. Similarly, the statistical analysis conducted on geographies consisting of 566,048,035 people shows a substantial negative correlation between the proportion of Blacks/African Americans and percentage of population with at least ged/equivalency education in the United States with a correlation coefficient (R) of -0.507 and weighted average of 82.8%, a difference of 0.48%.
GED/Equivalency Correlation Summary
| Measurement | Japanese | Black/African American |
| Minimum | 40.4% | 74.4% |
| Maximum | 100.0% | 87.6% |
| Range | 59.6% | 13.3% |
| Mean | 75.8% | 82.1% |
| Median | 79.8% | 82.0% |
| Interquartile 25% (IQ1) | 71.1% | 80.5% |
| Interquartile 75% (IQ3) | 83.9% | 83.8% |
| Interquartile Range (IQR) | 12.8% | 3.3% |
| Standard Deviation (Sample) | 13.3% | 2.6% |
| Standard Deviation (Population) | 13.1% | 2.6% |
Demographics Similar to Japanese and Blacks/African Americans by GED/Equivalency
In terms of ged/equivalency, the demographic groups most similar to Japanese are Immigrants from West Indies (82.4%, a difference of 0.020%), Cajun (82.4%, a difference of 0.040%), Immigrants from Barbados (82.4%, a difference of 0.070%), Pueblo (82.3%, a difference of 0.10%), and Immigrants from Cambodia (82.2%, a difference of 0.18%). Similarly, the demographic groups most similar to Blacks/African Americans are Seminole (82.8%, a difference of 0.020%), Arapaho (82.8%, a difference of 0.020%), Immigrants from Laos (82.7%, a difference of 0.050%), Immigrants from Fiji (82.7%, a difference of 0.060%), and Cheyenne (82.7%, a difference of 0.060%).
| Demographics | Rating | Rank | GED/Equivalency |
| U.S. Virgin Islanders | 0.2 /100 | #271 | Tragic 82.9% |
| Barbadians | 0.1 /100 | #272 | Tragic 82.9% |
| Pennsylvania Germans | 0.1 /100 | #273 | Tragic 82.9% |
| Immigrants | Trinidad and Tobago | 0.1 /100 | #274 | Tragic 82.8% |
| Seminole | 0.1 /100 | #275 | Tragic 82.8% |
| Blacks/African Americans | 0.1 /100 | #276 | Tragic 82.8% |
| Arapaho | 0.1 /100 | #277 | Tragic 82.8% |
| Immigrants | Laos | 0.1 /100 | #278 | Tragic 82.7% |
| Immigrants | Fiji | 0.1 /100 | #279 | Tragic 82.7% |
| Cheyenne | 0.1 /100 | #280 | Tragic 82.7% |
| Sioux | 0.1 /100 | #281 | Tragic 82.6% |
| Immigrants | Immigrants | 0.1 /100 | #282 | Tragic 82.6% |
| Indonesians | 0.1 /100 | #283 | Tragic 82.5% |
| Immigrants | Barbados | 0.1 /100 | #284 | Tragic 82.4% |
| Cajuns | 0.0 /100 | #285 | Tragic 82.4% |
| Immigrants | West Indies | 0.0 /100 | #286 | Tragic 82.4% |
| Japanese | 0.0 /100 | #287 | Tragic 82.4% |
| Pueblo | 0.0 /100 | #288 | Tragic 82.3% |
| Immigrants | Cambodia | 0.0 /100 | #289 | Tragic 82.2% |
| Haitians | 0.0 /100 | #290 | Tragic 82.1% |
| Cubans | 0.0 /100 | #291 | Tragic 82.0% |