Kiowa vs Immigrants from Western Asia Kindergarten
COMPARE
Kiowa
Immigrants from Western Asia
Kindergarten
Kindergarten Comparison
Kiowa
Immigrants from Western Asia
98.4%
KINDERGARTEN
99.8/ 100
METRIC RATING
49th/ 347
METRIC RANK
97.7%
KINDERGARTEN
2.1/ 100
METRIC RATING
236th/ 347
METRIC RANK
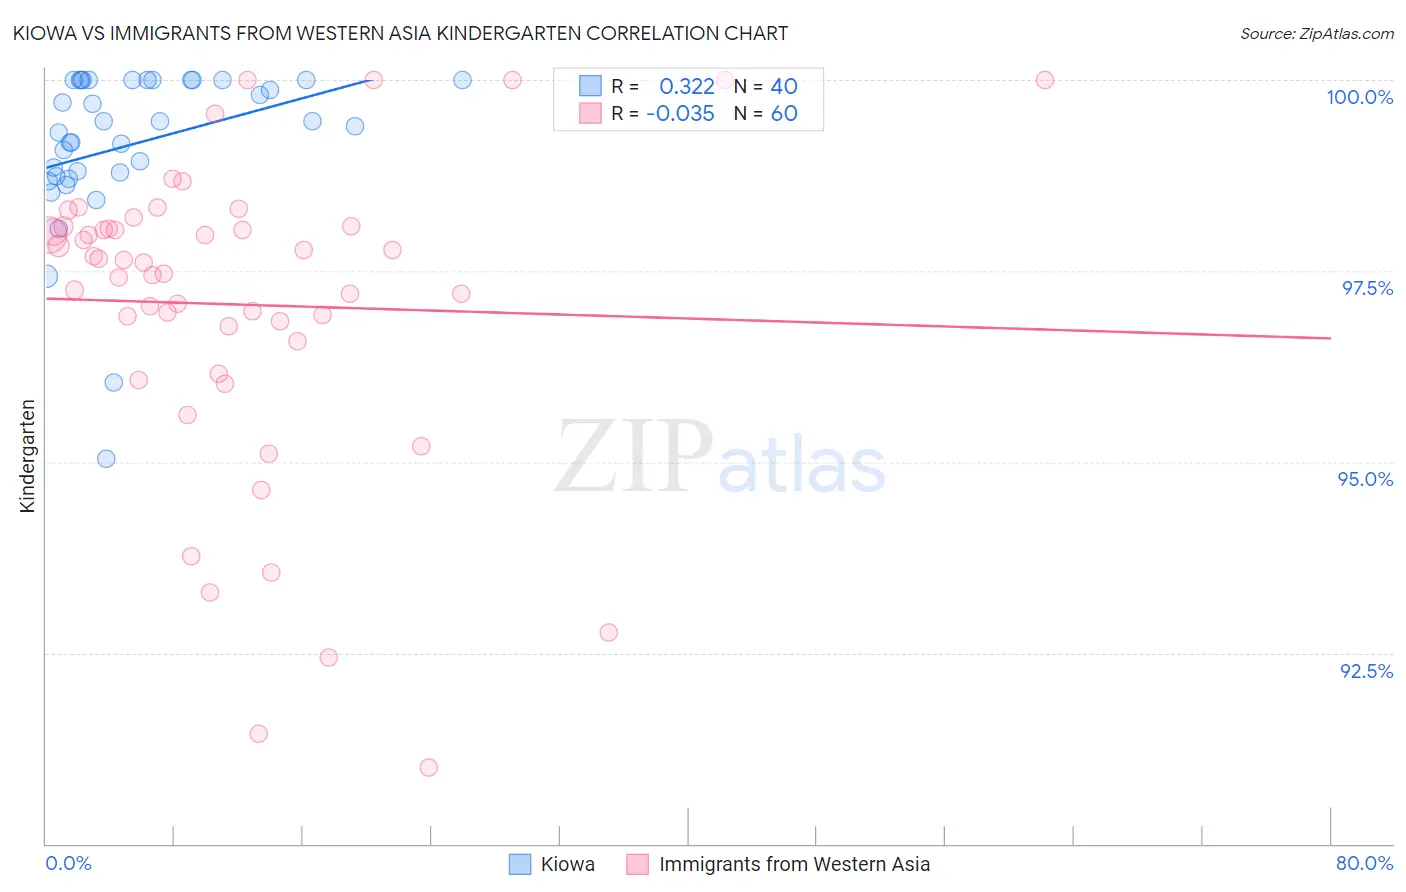
Kiowa vs Immigrants from Western Asia Kindergarten Correlation Chart
The statistical analysis conducted on geographies consisting of 56,100,633 people shows a mild positive correlation between the proportion of Kiowa and percentage of population with at least kindergarten education in the United States with a correlation coefficient (R) of 0.322 and weighted average of 98.4%. Similarly, the statistical analysis conducted on geographies consisting of 404,424,892 people shows no correlation between the proportion of Immigrants from Western Asia and percentage of population with at least kindergarten education in the United States with a correlation coefficient (R) of -0.035 and weighted average of 97.7%, a difference of 0.79%.
Kindergarten Correlation Summary
| Measurement | Kiowa | Immigrants from Western Asia |
| Minimum | 95.0% | 91.0% |
| Maximum | 100.0% | 100.0% |
| Range | 5.0% | 9.0% |
| Mean | 99.2% | 97.1% |
| Median | 99.4% | 97.6% |
| Interquartile 25% (IQ1) | 98.8% | 96.7% |
| Interquartile 75% (IQ3) | 100.0% | 98.1% |
| Interquartile Range (IQR) | 1.2% | 1.4% |
| Standard Deviation (Sample) | 1.1% | 2.0% |
| Standard Deviation (Population) | 1.1% | 2.0% |
Similar Demographics by Kindergarten
Demographics Similar to Kiowa by Kindergarten
In terms of kindergarten, the demographic groups most similar to Kiowa are White/Caucasian (98.4%, a difference of 0.0%), Estonian (98.4%, a difference of 0.0%), Australian (98.4%, a difference of 0.0%), Celtic (98.4%, a difference of 0.0%), and Czechoslovakian (98.4%, a difference of 0.010%).
| Demographics | Rating | Rank | Kindergarten |
| Native Hawaiians | 99.9 /100 | #42 | Exceptional 98.5% |
| Lumbee | 99.9 /100 | #43 | Exceptional 98.5% |
| Northern Europeans | 99.9 /100 | #44 | Exceptional 98.5% |
| Belgians | 99.9 /100 | #45 | Exceptional 98.5% |
| Hungarians | 99.9 /100 | #46 | Exceptional 98.5% |
| Czechoslovakians | 99.8 /100 | #47 | Exceptional 98.4% |
| Ottawa | 99.8 /100 | #48 | Exceptional 98.4% |
| Kiowa | 99.8 /100 | #49 | Exceptional 98.4% |
| Whites/Caucasians | 99.8 /100 | #50 | Exceptional 98.4% |
| Estonians | 99.8 /100 | #51 | Exceptional 98.4% |
| Australians | 99.8 /100 | #52 | Exceptional 98.4% |
| Celtics | 99.8 /100 | #53 | Exceptional 98.4% |
| Pueblo | 99.8 /100 | #54 | Exceptional 98.4% |
| Immigrants | Scotland | 99.8 /100 | #55 | Exceptional 98.4% |
| Americans | 99.8 /100 | #56 | Exceptional 98.4% |
Demographics Similar to Immigrants from Western Asia by Kindergarten
In terms of kindergarten, the demographic groups most similar to Immigrants from Western Asia are Immigrants from Pakistan (97.7%, a difference of 0.0%), Immigrants from Malaysia (97.7%, a difference of 0.0%), Colombian (97.7%, a difference of 0.0%), Immigrants from Uruguay (97.7%, a difference of 0.010%), and Nigerian (97.6%, a difference of 0.010%).
| Demographics | Rating | Rank | Kindergarten |
| Sierra Leoneans | 3.4 /100 | #229 | Tragic 97.7% |
| Senegalese | 3.3 /100 | #230 | Tragic 97.7% |
| Puerto Ricans | 2.7 /100 | #231 | Tragic 97.7% |
| Immigrants | Uruguay | 2.6 /100 | #232 | Tragic 97.7% |
| Immigrants | Pakistan | 2.2 /100 | #233 | Tragic 97.7% |
| Immigrants | Malaysia | 2.2 /100 | #234 | Tragic 97.7% |
| Colombians | 2.2 /100 | #235 | Tragic 97.7% |
| Immigrants | Western Asia | 2.1 /100 | #236 | Tragic 97.7% |
| Nigerians | 1.8 /100 | #237 | Tragic 97.6% |
| Immigrants | Eastern Asia | 1.7 /100 | #238 | Tragic 97.6% |
| U.S. Virgin Islanders | 1.7 /100 | #239 | Tragic 97.6% |
| Koreans | 1.6 /100 | #240 | Tragic 97.6% |
| Liberians | 1.3 /100 | #241 | Tragic 97.6% |
| Immigrants | Indonesia | 1.3 /100 | #242 | Tragic 97.6% |
| Asians | 1.2 /100 | #243 | Tragic 97.6% |