Lumbee vs Yuman 10th Grade
COMPARE
Lumbee
Yuman
10th Grade
10th Grade Comparison
Lumbee
Yuman
91.7%
10TH GRADE
0.0/ 100
METRIC RATING
295th/ 347
METRIC RANK
92.0%
10TH GRADE
0.0/ 100
METRIC RATING
286th/ 347
METRIC RANK
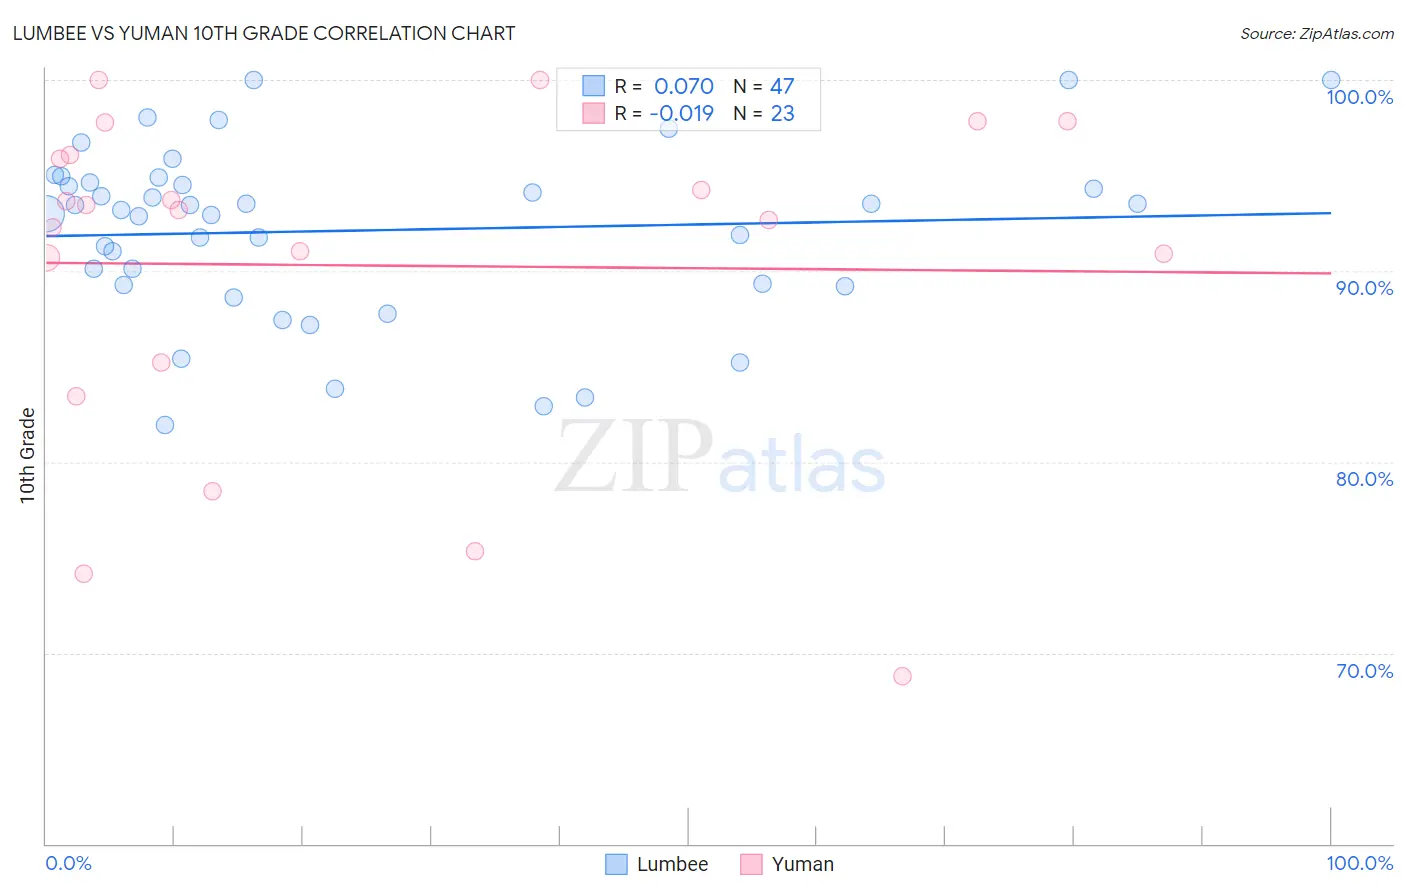
Lumbee vs Yuman 10th Grade Correlation Chart
The statistical analysis conducted on geographies consisting of 92,299,110 people shows a slight positive correlation between the proportion of Lumbee and percentage of population with at least 10th grade education in the United States with a correlation coefficient (R) of 0.070 and weighted average of 91.7%. Similarly, the statistical analysis conducted on geographies consisting of 40,696,349 people shows no correlation between the proportion of Yuman and percentage of population with at least 10th grade education in the United States with a correlation coefficient (R) of -0.019 and weighted average of 92.0%, a difference of 0.30%.
10th Grade Correlation Summary
| Measurement | Lumbee | Yuman |
| Minimum | 81.9% | 68.8% |
| Maximum | 100.0% | 100.0% |
| Range | 18.1% | 31.2% |
| Mean | 92.1% | 90.3% |
| Median | 93.2% | 93.2% |
| Interquartile 25% (IQ1) | 89.2% | 85.2% |
| Interquartile 75% (IQ3) | 94.7% | 96.0% |
| Interquartile Range (IQR) | 5.4% | 10.8% |
| Standard Deviation (Sample) | 4.5% | 8.7% |
| Standard Deviation (Population) | 4.4% | 8.5% |
Demographics Similar to Lumbee and Yuman by 10th Grade
In terms of 10th grade, the demographic groups most similar to Lumbee are Haitian (91.8%, a difference of 0.030%), Indonesian (91.8%, a difference of 0.060%), Immigrants from West Indies (91.8%, a difference of 0.080%), Immigrants from Burma/Myanmar (91.8%, a difference of 0.080%), and British West Indian (91.8%, a difference of 0.090%). Similarly, the demographic groups most similar to Yuman are Immigrants from South Eastern Asia (92.1%, a difference of 0.050%), Immigrants from Barbados (92.1%, a difference of 0.070%), Immigrants from St. Vincent and the Grenadines (92.1%, a difference of 0.090%), Immigrants from Peru (92.2%, a difference of 0.15%), and Pennsylvania German (91.9%, a difference of 0.15%).
| Demographics | Rating | Rank | 10th Grade |
| Malaysians | 0.1 /100 | #280 | Tragic 92.2% |
| Bangladeshis | 0.1 /100 | #281 | Tragic 92.2% |
| Immigrants | Peru | 0.1 /100 | #282 | Tragic 92.2% |
| Immigrants | St. Vincent and the Grenadines | 0.0 /100 | #283 | Tragic 92.1% |
| Immigrants | Barbados | 0.0 /100 | #284 | Tragic 92.1% |
| Immigrants | South Eastern Asia | 0.0 /100 | #285 | Tragic 92.1% |
| Yuman | 0.0 /100 | #286 | Tragic 92.0% |
| Pennsylvania Germans | 0.0 /100 | #287 | Tragic 91.9% |
| Immigrants | Laos | 0.0 /100 | #288 | Tragic 91.9% |
| Sri Lankans | 0.0 /100 | #289 | Tragic 91.8% |
| British West Indians | 0.0 /100 | #290 | Tragic 91.8% |
| Immigrants | West Indies | 0.0 /100 | #291 | Tragic 91.8% |
| Immigrants | Burma/Myanmar | 0.0 /100 | #292 | Tragic 91.8% |
| Indonesians | 0.0 /100 | #293 | Tragic 91.8% |
| Haitians | 0.0 /100 | #294 | Tragic 91.8% |
| Lumbee | 0.0 /100 | #295 | Tragic 91.7% |
| Immigrants | Grenada | 0.0 /100 | #296 | Tragic 91.6% |
| Fijians | 0.0 /100 | #297 | Tragic 91.5% |
| Cubans | 0.0 /100 | #298 | Tragic 91.5% |
| Immigrants | Haiti | 0.0 /100 | #299 | Tragic 91.4% |
| Guyanese | 0.0 /100 | #300 | Tragic 91.4% |