Macedonian vs Creek Bachelor's Degree
COMPARE
Macedonian
Creek
Bachelor's Degree
Bachelor's Degree Comparison
Macedonians
Creek
41.4%
BACHELOR'S DEGREE
98.1/ 100
METRIC RATING
100th/ 347
METRIC RANK
28.9%
BACHELOR'S DEGREE
0.0/ 100
METRIC RATING
319th/ 347
METRIC RANK
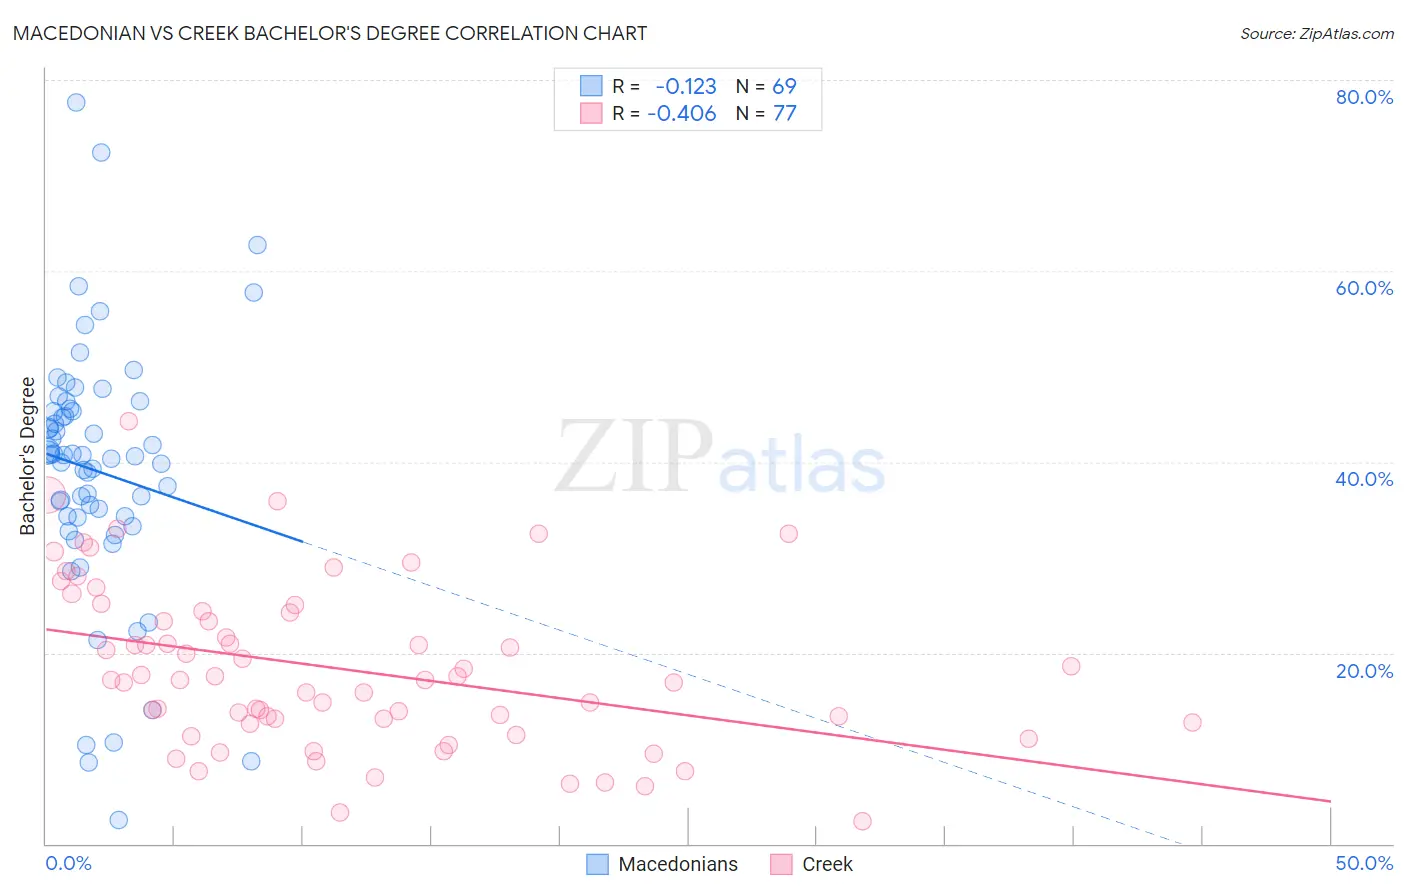
Macedonian vs Creek Bachelor's Degree Correlation Chart
The statistical analysis conducted on geographies consisting of 132,656,802 people shows a poor negative correlation between the proportion of Macedonians and percentage of population with at least bachelor's degree education in the United States with a correlation coefficient (R) of -0.123 and weighted average of 41.4%. Similarly, the statistical analysis conducted on geographies consisting of 178,478,956 people shows a moderate negative correlation between the proportion of Creek and percentage of population with at least bachelor's degree education in the United States with a correlation coefficient (R) of -0.406 and weighted average of 28.9%, a difference of 43.6%.
Bachelor's Degree Correlation Summary
| Measurement | Macedonian | Creek |
| Minimum | 2.5% | 2.3% |
| Maximum | 77.6% | 44.3% |
| Range | 75.1% | 42.0% |
| Mean | 39.1% | 18.4% |
| Median | 40.7% | 17.1% |
| Interquartile 25% (IQ1) | 34.2% | 12.7% |
| Interquartile 75% (IQ3) | 45.5% | 24.3% |
| Interquartile Range (IQR) | 11.3% | 11.6% |
| Standard Deviation (Sample) | 13.5% | 8.6% |
| Standard Deviation (Population) | 13.4% | 8.6% |
Similar Demographics by Bachelor's Degree
Demographics Similar to Macedonians by Bachelor's Degree
In terms of bachelor's degree, the demographic groups most similar to Macedonians are Immigrants from England (41.4%, a difference of 0.030%), Immigrants from Morocco (41.4%, a difference of 0.030%), Immigrants from Ukraine (41.5%, a difference of 0.26%), Immigrants from Italy (41.3%, a difference of 0.29%), and Romanian (41.6%, a difference of 0.37%).
| Demographics | Rating | Rank | Bachelor's Degree |
| Immigrants | Canada | 98.6 /100 | #93 | Exceptional 41.7% |
| Immigrants | Nepal | 98.6 /100 | #94 | Exceptional 41.7% |
| Immigrants | North America | 98.5 /100 | #95 | Exceptional 41.7% |
| Immigrants | Moldova | 98.4 /100 | #96 | Exceptional 41.6% |
| Romanians | 98.4 /100 | #97 | Exceptional 41.6% |
| Immigrants | Ukraine | 98.3 /100 | #98 | Exceptional 41.5% |
| Immigrants | England | 98.1 /100 | #99 | Exceptional 41.4% |
| Macedonians | 98.1 /100 | #100 | Exceptional 41.4% |
| Immigrants | Morocco | 98.0 /100 | #101 | Exceptional 41.4% |
| Immigrants | Italy | 97.8 /100 | #102 | Exceptional 41.3% |
| Chileans | 97.5 /100 | #103 | Exceptional 41.2% |
| Jordanians | 97.4 /100 | #104 | Exceptional 41.2% |
| Syrians | 97.4 /100 | #105 | Exceptional 41.1% |
| Alsatians | 97.0 /100 | #106 | Exceptional 41.0% |
| Northern Europeans | 96.8 /100 | #107 | Exceptional 41.0% |
Demographics Similar to Creek by Bachelor's Degree
In terms of bachelor's degree, the demographic groups most similar to Creek are Kiowa (28.8%, a difference of 0.040%), Alaskan Athabascan (28.8%, a difference of 0.13%), Tsimshian (28.8%, a difference of 0.35%), Yaqui (29.0%, a difference of 0.45%), and Fijian (28.7%, a difference of 0.48%).
| Demographics | Rating | Rank | Bachelor's Degree |
| Seminole | 0.0 /100 | #312 | Tragic 29.4% |
| Alaska Natives | 0.0 /100 | #313 | Tragic 29.4% |
| Shoshone | 0.0 /100 | #314 | Tragic 29.3% |
| Immigrants | Cabo Verde | 0.0 /100 | #315 | Tragic 29.2% |
| Sioux | 0.0 /100 | #316 | Tragic 29.1% |
| Colville | 0.0 /100 | #317 | Tragic 29.0% |
| Yaqui | 0.0 /100 | #318 | Tragic 29.0% |
| Creek | 0.0 /100 | #319 | Tragic 28.9% |
| Kiowa | 0.0 /100 | #320 | Tragic 28.8% |
| Alaskan Athabascans | 0.0 /100 | #321 | Tragic 28.8% |
| Tsimshian | 0.0 /100 | #322 | Tragic 28.8% |
| Fijians | 0.0 /100 | #323 | Tragic 28.7% |
| Dutch West Indians | 0.0 /100 | #324 | Tragic 28.5% |
| Pennsylvania Germans | 0.0 /100 | #325 | Tragic 28.4% |
| Apache | 0.0 /100 | #326 | Tragic 28.3% |