Maltese vs Immigrants from Bangladesh Kindergarten
COMPARE
Maltese
Immigrants from Bangladesh
Kindergarten
Kindergarten Comparison
Maltese
Immigrants from Bangladesh
98.4%
KINDERGARTEN
99.7/ 100
METRIC RATING
65th/ 347
METRIC RANK
96.8%
KINDERGARTEN
0.0/ 100
METRIC RATING
321st/ 347
METRIC RANK
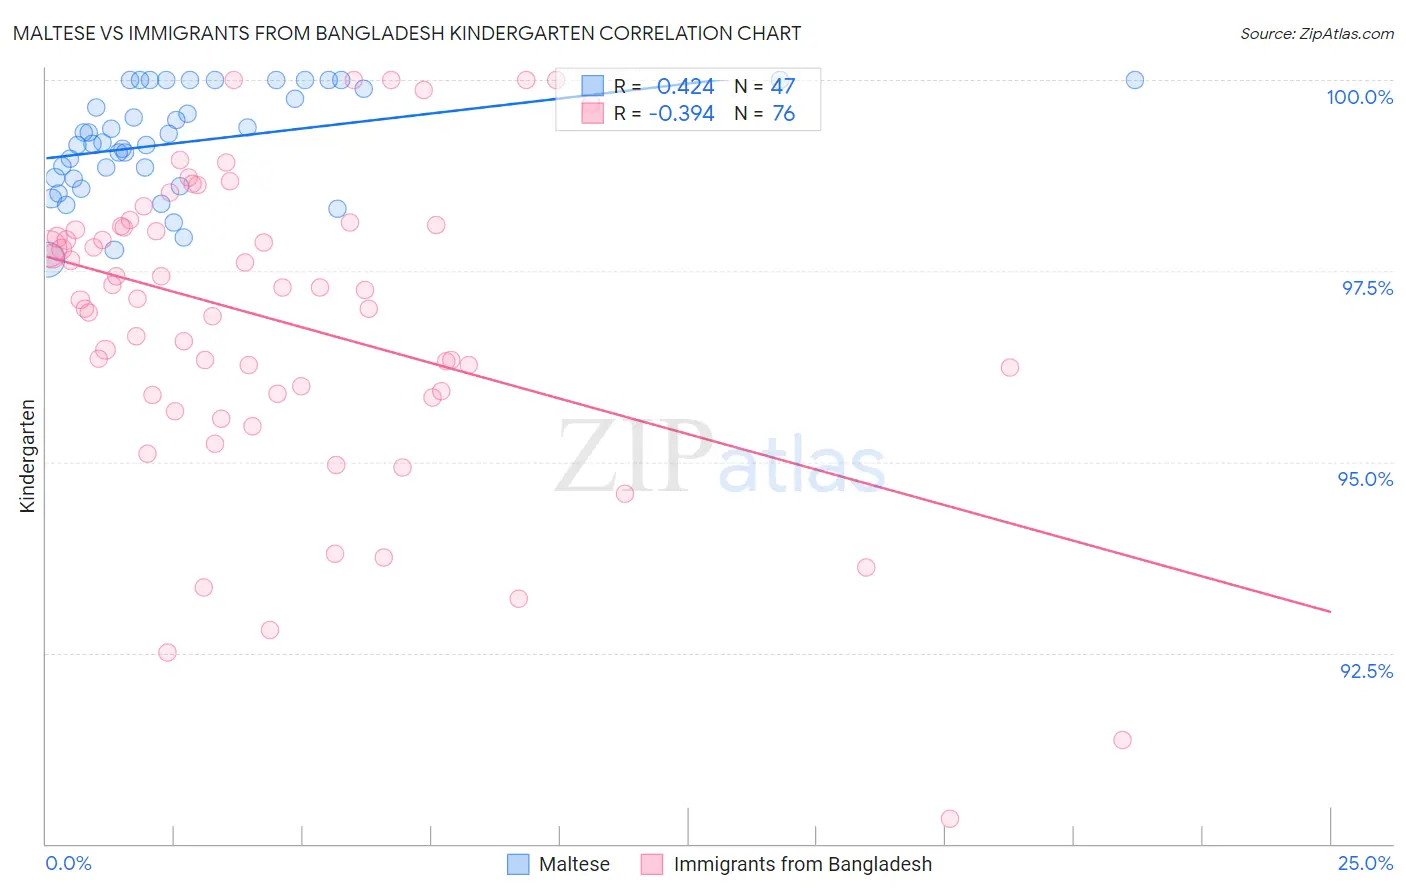
Maltese vs Immigrants from Bangladesh Kindergarten Correlation Chart
The statistical analysis conducted on geographies consisting of 126,476,608 people shows a moderate positive correlation between the proportion of Maltese and percentage of population with at least kindergarten education in the United States with a correlation coefficient (R) of 0.424 and weighted average of 98.4%. Similarly, the statistical analysis conducted on geographies consisting of 203,681,254 people shows a mild negative correlation between the proportion of Immigrants from Bangladesh and percentage of population with at least kindergarten education in the United States with a correlation coefficient (R) of -0.394 and weighted average of 96.8%, a difference of 1.6%.
Kindergarten Correlation Summary
| Measurement | Maltese | Immigrants from Bangladesh |
| Minimum | 97.6% | 90.3% |
| Maximum | 100.0% | 100.0% |
| Range | 2.4% | 9.7% |
| Mean | 99.2% | 96.8% |
| Median | 99.2% | 97.2% |
| Interquartile 25% (IQ1) | 98.7% | 95.9% |
| Interquartile 75% (IQ3) | 100.0% | 98.1% |
| Interquartile Range (IQR) | 1.3% | 2.2% |
| Standard Deviation (Sample) | 0.68% | 2.0% |
| Standard Deviation (Population) | 0.67% | 2.0% |
Similar Demographics by Kindergarten
Demographics Similar to Maltese by Kindergarten
In terms of kindergarten, the demographic groups most similar to Maltese are Immigrants from North America (98.4%, a difference of 0.0%), Greek (98.4%, a difference of 0.0%), Bulgarian (98.4%, a difference of 0.010%), Immigrants from Canada (98.4%, a difference of 0.010%), and Creek (98.4%, a difference of 0.010%).
| Demographics | Rating | Rank | Kindergarten |
| Bulgarians | 99.7 /100 | #58 | Exceptional 98.4% |
| Immigrants | Canada | 99.7 /100 | #59 | Exceptional 98.4% |
| Creek | 99.7 /100 | #60 | Exceptional 98.4% |
| Slavs | 99.7 /100 | #61 | Exceptional 98.4% |
| New Zealanders | 99.7 /100 | #62 | Exceptional 98.4% |
| Immigrants | North America | 99.7 /100 | #63 | Exceptional 98.4% |
| Greeks | 99.7 /100 | #64 | Exceptional 98.4% |
| Maltese | 99.7 /100 | #65 | Exceptional 98.4% |
| Cheyenne | 99.6 /100 | #66 | Exceptional 98.4% |
| Canadians | 99.6 /100 | #67 | Exceptional 98.4% |
| Immigrants | Northern Europe | 99.6 /100 | #68 | Exceptional 98.4% |
| Immigrants | Austria | 99.6 /100 | #69 | Exceptional 98.4% |
| Russians | 99.6 /100 | #70 | Exceptional 98.4% |
| Chickasaw | 99.6 /100 | #71 | Exceptional 98.4% |
| Serbians | 99.6 /100 | #72 | Exceptional 98.4% |
Demographics Similar to Immigrants from Bangladesh by Kindergarten
In terms of kindergarten, the demographic groups most similar to Immigrants from Bangladesh are Immigrants from Guyana (96.8%, a difference of 0.010%), Immigrants from Burma/Myanmar (96.8%, a difference of 0.010%), Mexican American Indian (96.8%, a difference of 0.010%), Immigrants from Laos (96.9%, a difference of 0.020%), and Immigrants from Honduras (96.8%, a difference of 0.020%).
| Demographics | Rating | Rank | Kindergarten |
| Hondurans | 0.0 /100 | #314 | Tragic 96.9% |
| Immigrants | Belize | 0.0 /100 | #315 | Tragic 96.9% |
| Immigrants | Nicaragua | 0.0 /100 | #316 | Tragic 96.9% |
| Immigrants | Ecuador | 0.0 /100 | #317 | Tragic 96.9% |
| Immigrants | Laos | 0.0 /100 | #318 | Tragic 96.9% |
| Immigrants | Guyana | 0.0 /100 | #319 | Tragic 96.8% |
| Immigrants | Burma/Myanmar | 0.0 /100 | #320 | Tragic 96.8% |
| Immigrants | Bangladesh | 0.0 /100 | #321 | Tragic 96.8% |
| Mexican American Indians | 0.0 /100 | #322 | Tragic 96.8% |
| Immigrants | Honduras | 0.0 /100 | #323 | Tragic 96.8% |
| Vietnamese | 0.0 /100 | #324 | Tragic 96.8% |
| Indonesians | 0.0 /100 | #325 | Tragic 96.8% |
| Dominicans | 0.0 /100 | #326 | Tragic 96.8% |
| Mexicans | 0.0 /100 | #327 | Tragic 96.7% |
| Immigrants | Latin America | 0.0 /100 | #328 | Tragic 96.7% |