Moroccan vs Crow 1st Grade
COMPARE
Moroccan
Crow
1st Grade
1st Grade Comparison
Moroccans
Crow
97.7%
1ST GRADE
8.7/ 100
METRIC RATING
212th/ 347
METRIC RANK
99.6%
1ST GRADE
100.0/ 100
METRIC RATING
1st/ 347
METRIC RANK
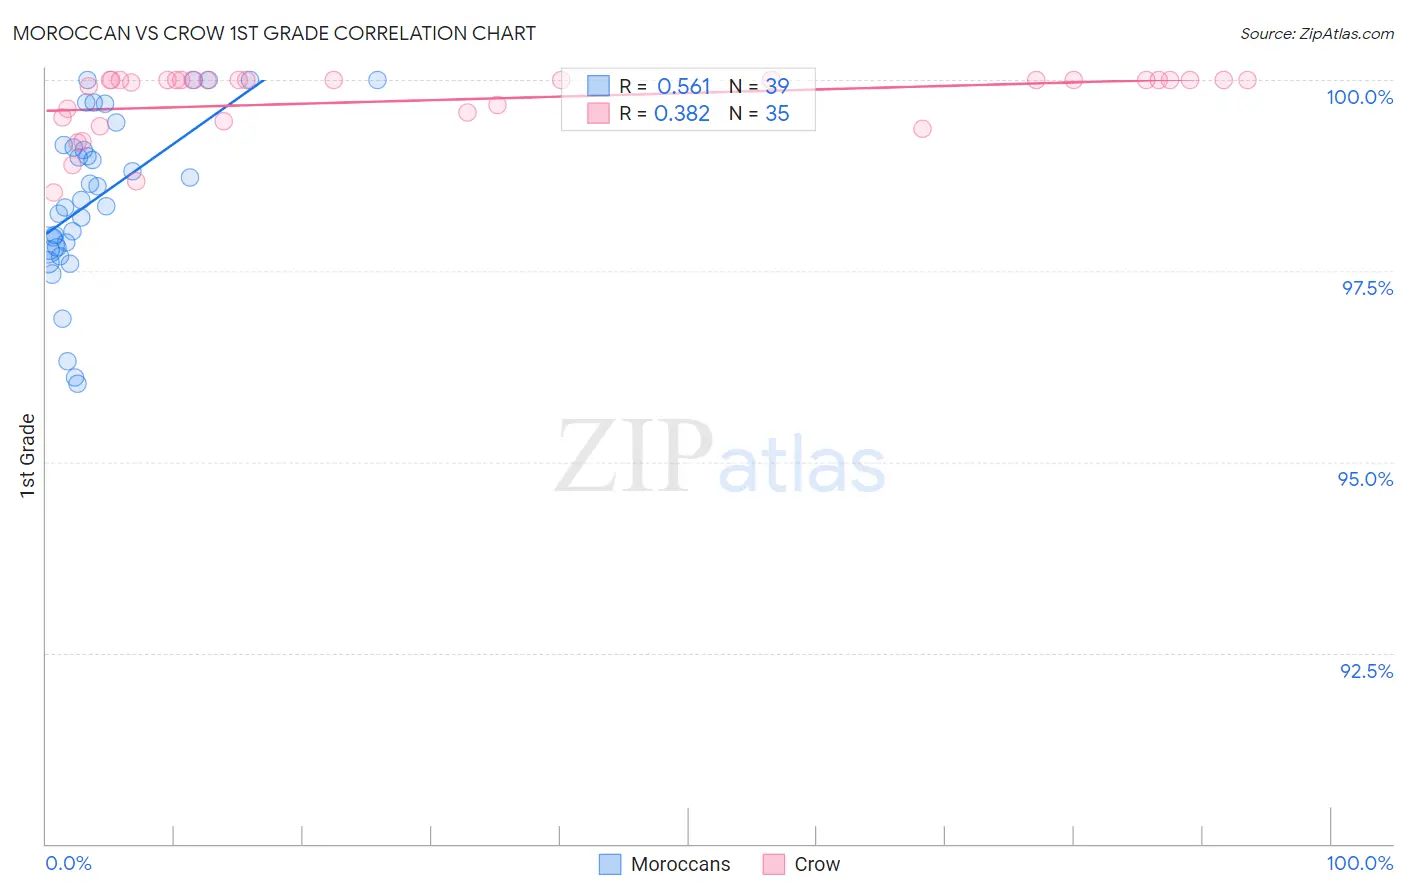
Moroccan vs Crow 1st Grade Correlation Chart
The statistical analysis conducted on geographies consisting of 201,817,667 people shows a substantial positive correlation between the proportion of Moroccans and percentage of population with at least 1st grade education in the United States with a correlation coefficient (R) of 0.561 and weighted average of 97.7%. Similarly, the statistical analysis conducted on geographies consisting of 665,246 people shows a mild positive correlation between the proportion of Crow and percentage of population with at least 1st grade education in the United States with a correlation coefficient (R) of 0.382 and weighted average of 99.6%, a difference of 1.9%.
1st Grade Correlation Summary
| Measurement | Moroccan | Crow |
| Minimum | 96.0% | 98.5% |
| Maximum | 100.0% | 100.0% |
| Range | 4.0% | 1.5% |
| Mean | 98.5% | 99.7% |
| Median | 98.4% | 100.0% |
| Interquartile 25% (IQ1) | 97.8% | 99.5% |
| Interquartile 75% (IQ3) | 99.1% | 100.0% |
| Interquartile Range (IQR) | 1.3% | 0.49% |
| Standard Deviation (Sample) | 1.1% | 0.42% |
| Standard Deviation (Population) | 1.1% | 0.41% |
Similar Demographics by 1st Grade
Demographics Similar to Moroccans by 1st Grade
In terms of 1st grade, the demographic groups most similar to Moroccans are Laotian (97.8%, a difference of 0.010%), Immigrants from Bahamas (97.7%, a difference of 0.010%), South American Indian (97.7%, a difference of 0.010%), Bahamian (97.7%, a difference of 0.010%), and Uruguayan (97.7%, a difference of 0.010%).
| Demographics | Rating | Rank | 1st Grade |
| Immigrants | Chile | 17.7 /100 | #205 | Poor 97.8% |
| Immigrants | Albania | 17.3 /100 | #206 | Poor 97.8% |
| Africans | 16.5 /100 | #207 | Poor 97.8% |
| Immigrants | Northern Africa | 12.0 /100 | #208 | Poor 97.8% |
| Costa Ricans | 11.6 /100 | #209 | Poor 97.8% |
| Immigrants | Oceania | 11.0 /100 | #210 | Poor 97.8% |
| Laotians | 10.3 /100 | #211 | Poor 97.8% |
| Moroccans | 8.7 /100 | #212 | Tragic 97.7% |
| Immigrants | Bahamas | 8.1 /100 | #213 | Tragic 97.7% |
| South American Indians | 7.6 /100 | #214 | Tragic 97.7% |
| Bahamians | 7.5 /100 | #215 | Tragic 97.7% |
| Uruguayans | 7.4 /100 | #216 | Tragic 97.7% |
| Samoans | 6.8 /100 | #217 | Tragic 97.7% |
| Immigrants | Morocco | 5.3 /100 | #218 | Tragic 97.7% |
| Immigrants | Panama | 5.2 /100 | #219 | Tragic 97.7% |
Demographics Similar to Crow by 1st Grade
In terms of 1st grade, the demographic groups most similar to Crow are Yup'ik (99.2%, a difference of 0.46%), Inupiat (98.9%, a difference of 0.79%), Welsh (98.9%, a difference of 0.80%), Tsimshian (98.8%, a difference of 0.83%), and Alaskan Athabascan (98.8%, a difference of 0.89%).
| Demographics | Rating | Rank | 1st Grade |
| Crow | 100.0 /100 | #1 | Exceptional 99.6% |
| Yup'ik | 100.0 /100 | #2 | Exceptional 99.2% |
| Inupiat | 100.0 /100 | #3 | Exceptional 98.9% |
| Welsh | 100.0 /100 | #4 | Exceptional 98.9% |
| Tsimshian | 100.0 /100 | #5 | Exceptional 98.8% |
| Alaskan Athabascans | 100.0 /100 | #6 | Exceptional 98.8% |
| Alaska Natives | 100.0 /100 | #7 | Exceptional 98.7% |
| Norwegians | 100.0 /100 | #8 | Exceptional 98.7% |
| Slovaks | 100.0 /100 | #9 | Exceptional 98.7% |
| Germans | 100.0 /100 | #10 | Exceptional 98.7% |
| Tlingit-Haida | 100.0 /100 | #11 | Exceptional 98.7% |
| Slovenes | 100.0 /100 | #12 | Exceptional 98.7% |
| Carpatho Rusyns | 100.0 /100 | #13 | Exceptional 98.6% |
| English | 100.0 /100 | #14 | Exceptional 98.6% |
| Swedes | 100.0 /100 | #15 | Exceptional 98.6% |