Nepalese vs Immigrants from Venezuela Associate's Degree
COMPARE
Nepalese
Immigrants from Venezuela
Associate's Degree
Associate's Degree Comparison
Nepalese
Immigrants from Venezuela
39.0%
ASSOCIATE'S DEGREE
0.0/ 100
METRIC RATING
293rd/ 347
METRIC RANK
49.1%
ASSOCIATE'S DEGREE
95.8/ 100
METRIC RATING
111th/ 347
METRIC RANK
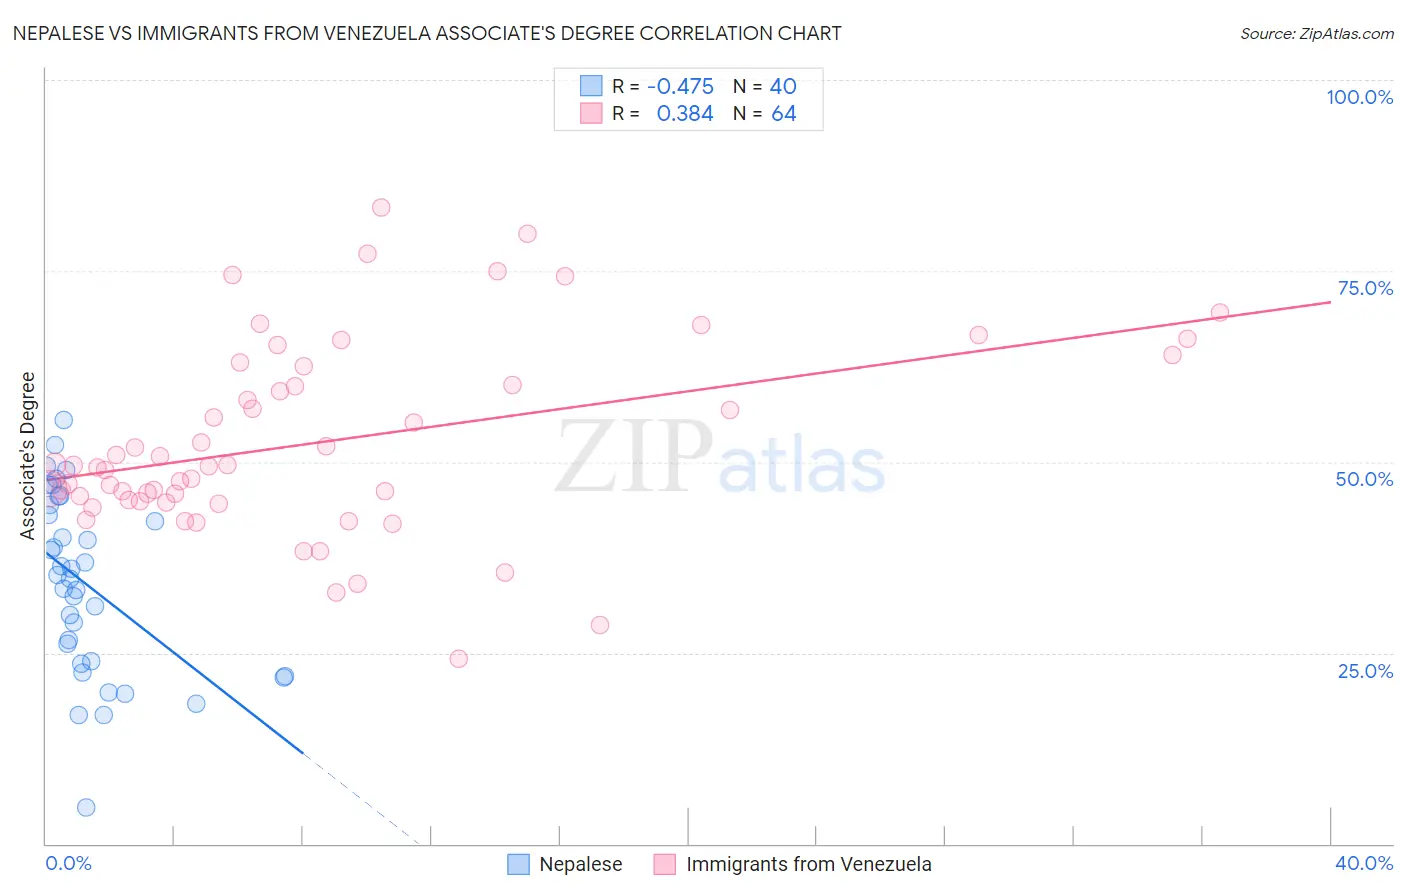
Nepalese vs Immigrants from Venezuela Associate's Degree Correlation Chart
The statistical analysis conducted on geographies consisting of 24,521,755 people shows a moderate negative correlation between the proportion of Nepalese and percentage of population with at least associate's degree education in the United States with a correlation coefficient (R) of -0.475 and weighted average of 39.0%. Similarly, the statistical analysis conducted on geographies consisting of 287,855,675 people shows a mild positive correlation between the proportion of Immigrants from Venezuela and percentage of population with at least associate's degree education in the United States with a correlation coefficient (R) of 0.384 and weighted average of 49.1%, a difference of 25.6%.
Associate's Degree Correlation Summary
| Measurement | Nepalese | Immigrants from Venezuela |
| Minimum | 4.8% | 24.3% |
| Maximum | 55.5% | 83.4% |
| Range | 50.8% | 59.1% |
| Mean | 33.9% | 52.6% |
| Median | 35.0% | 49.4% |
| Interquartile 25% (IQ1) | 23.7% | 44.9% |
| Interquartile 75% (IQ3) | 43.7% | 61.3% |
| Interquartile Range (IQR) | 20.0% | 16.4% |
| Standard Deviation (Sample) | 11.7% | 12.6% |
| Standard Deviation (Population) | 11.6% | 12.5% |
Similar Demographics by Associate's Degree
Demographics Similar to Nepalese by Associate's Degree
In terms of associate's degree, the demographic groups most similar to Nepalese are Salvadoran (39.0%, a difference of 0.0%), Black/African American (39.1%, a difference of 0.25%), Honduran (38.9%, a difference of 0.29%), Cherokee (38.9%, a difference of 0.46%), and Dominican (39.3%, a difference of 0.54%).
| Demographics | Rating | Rank | Associate's Degree |
| Immigrants | Caribbean | 0.0 /100 | #286 | Tragic 39.7% |
| Aleuts | 0.0 /100 | #287 | Tragic 39.6% |
| Immigrants | Cuba | 0.0 /100 | #288 | Tragic 39.5% |
| Central Americans | 0.0 /100 | #289 | Tragic 39.4% |
| Immigrants | Haiti | 0.0 /100 | #290 | Tragic 39.3% |
| Dominicans | 0.0 /100 | #291 | Tragic 39.3% |
| Blacks/African Americans | 0.0 /100 | #292 | Tragic 39.1% |
| Nepalese | 0.0 /100 | #293 | Tragic 39.0% |
| Salvadorans | 0.0 /100 | #294 | Tragic 39.0% |
| Hondurans | 0.0 /100 | #295 | Tragic 38.9% |
| Cherokee | 0.0 /100 | #296 | Tragic 38.9% |
| Cape Verdeans | 0.0 /100 | #297 | Tragic 38.8% |
| Cheyenne | 0.0 /100 | #298 | Tragic 38.7% |
| Ute | 0.0 /100 | #299 | Tragic 38.6% |
| Chickasaw | 0.0 /100 | #300 | Tragic 38.6% |
Demographics Similar to Immigrants from Venezuela by Associate's Degree
In terms of associate's degree, the demographic groups most similar to Immigrants from Venezuela are Austrian (49.1%, a difference of 0.030%), Immigrants from Chile (49.0%, a difference of 0.19%), Palestinian (49.0%, a difference of 0.19%), Arab (49.0%, a difference of 0.19%), and Immigrants from Morocco (49.2%, a difference of 0.26%).
| Demographics | Rating | Rank | Associate's Degree |
| Venezuelans | 97.0 /100 | #104 | Exceptional 49.4% |
| Croatians | 96.8 /100 | #105 | Exceptional 49.3% |
| Immigrants | Italy | 96.7 /100 | #106 | Exceptional 49.3% |
| Syrians | 96.7 /100 | #107 | Exceptional 49.3% |
| Jordanians | 96.6 /100 | #108 | Exceptional 49.2% |
| Immigrants | Morocco | 96.3 /100 | #109 | Exceptional 49.2% |
| Austrians | 95.8 /100 | #110 | Exceptional 49.1% |
| Immigrants | Venezuela | 95.8 /100 | #111 | Exceptional 49.1% |
| Immigrants | Chile | 95.3 /100 | #112 | Exceptional 49.0% |
| Palestinians | 95.3 /100 | #113 | Exceptional 49.0% |
| Arabs | 95.3 /100 | #114 | Exceptional 49.0% |
| Luxembourgers | 95.1 /100 | #115 | Exceptional 48.9% |
| British | 95.0 /100 | #116 | Exceptional 48.9% |
| Afghans | 94.8 /100 | #117 | Exceptional 48.9% |
| Albanians | 94.7 /100 | #118 | Exceptional 48.8% |