Northern European vs Argentinean No Schooling Completed
COMPARE
Northern European
Argentinean
No Schooling Completed
No Schooling Completed Comparison
Northern Europeans
Argentineans
1.6%
NO SCHOOLING COMPLETED
99.9/ 100
METRIC RATING
38th/ 347
METRIC RANK
2.1%
NO SCHOOLING COMPLETED
56.0/ 100
METRIC RATING
170th/ 347
METRIC RANK
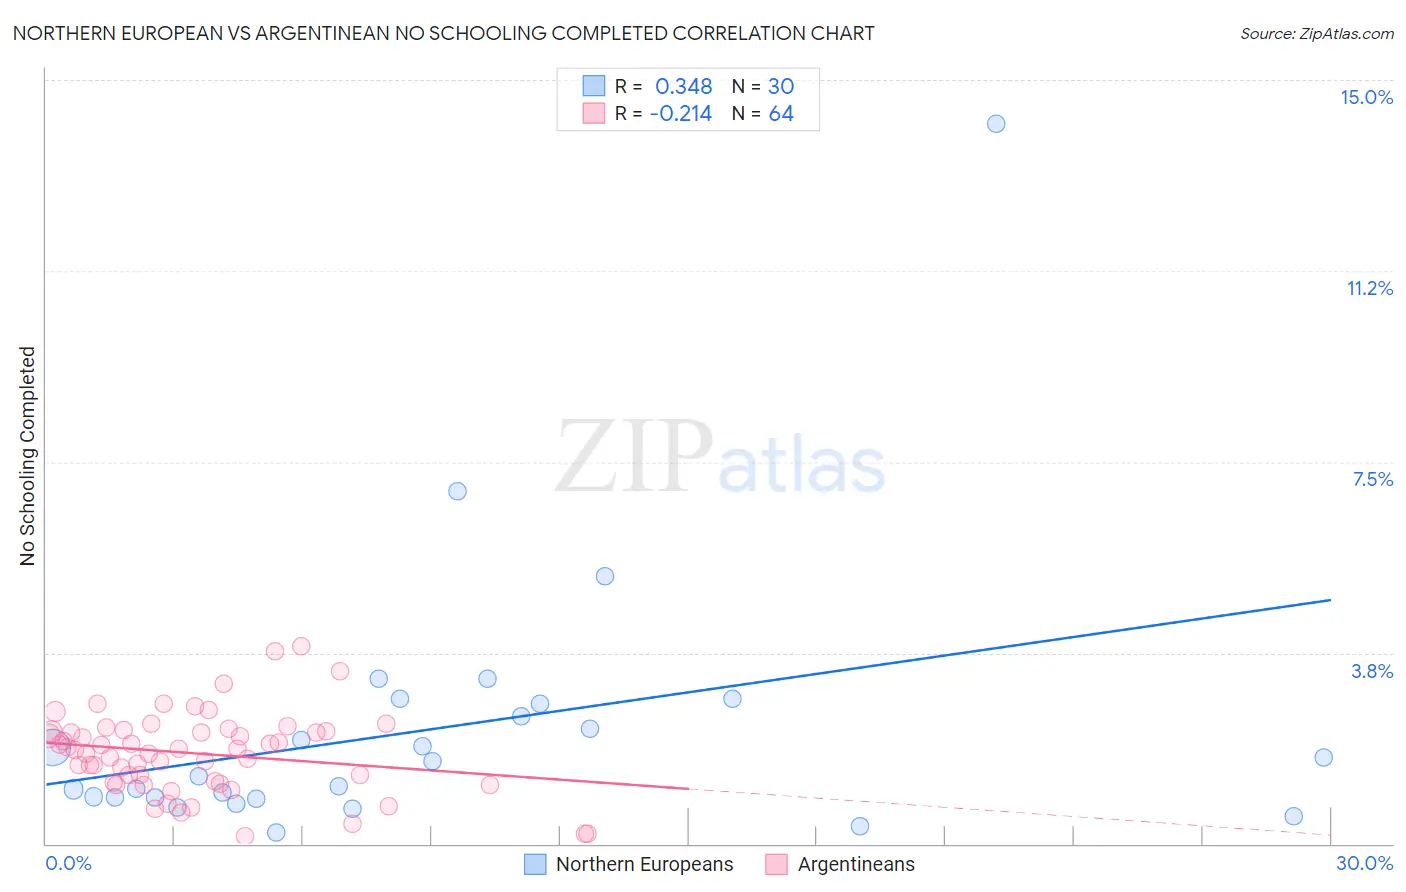
Northern European vs Argentinean No Schooling Completed Correlation Chart
The statistical analysis conducted on geographies consisting of 399,870,964 people shows a mild positive correlation between the proportion of Northern Europeans and percentage of population with no schooling in the United States with a correlation coefficient (R) of 0.348 and weighted average of 1.6%. Similarly, the statistical analysis conducted on geographies consisting of 295,019,263 people shows a weak negative correlation between the proportion of Argentineans and percentage of population with no schooling in the United States with a correlation coefficient (R) of -0.214 and weighted average of 2.1%, a difference of 31.4%.
No Schooling Completed Correlation Summary
| Measurement | Northern European | Argentinean |
| Minimum | 0.21% | 0.14% |
| Maximum | 14.1% | 3.9% |
| Range | 13.9% | 3.7% |
| Mean | 2.3% | 1.8% |
| Median | 1.5% | 1.8% |
| Interquartile 25% (IQ1) | 0.90% | 1.2% |
| Interquartile 75% (IQ3) | 2.8% | 2.2% |
| Interquartile Range (IQR) | 1.8% | 0.99% |
| Standard Deviation (Sample) | 2.7% | 0.79% |
| Standard Deviation (Population) | 2.6% | 0.79% |
Similar Demographics by No Schooling Completed
Demographics Similar to Northern Europeans by No Schooling Completed
In terms of no schooling completed, the demographic groups most similar to Northern Europeans are Belgian (1.6%, a difference of 0.13%), Native Hawaiian (1.6%, a difference of 0.27%), Aleut (1.6%, a difference of 0.40%), Luxembourger (1.6%, a difference of 0.61%), and Hungarian (1.6%, a difference of 0.89%).
| Demographics | Rating | Rank | No Schooling Completed |
| Inupiat | 100.0 /100 | #31 | Exceptional 1.5% |
| Swiss | 100.0 /100 | #32 | Exceptional 1.5% |
| Italians | 100.0 /100 | #33 | Exceptional 1.5% |
| Latvians | 100.0 /100 | #34 | Exceptional 1.5% |
| Eastern Europeans | 100.0 /100 | #35 | Exceptional 1.6% |
| Aleuts | 99.9 /100 | #36 | Exceptional 1.6% |
| Belgians | 99.9 /100 | #37 | Exceptional 1.6% |
| Northern Europeans | 99.9 /100 | #38 | Exceptional 1.6% |
| Native Hawaiians | 99.9 /100 | #39 | Exceptional 1.6% |
| Luxembourgers | 99.9 /100 | #40 | Exceptional 1.6% |
| Hungarians | 99.9 /100 | #41 | Exceptional 1.6% |
| Bulgarians | 99.9 /100 | #42 | Exceptional 1.6% |
| Australians | 99.9 /100 | #43 | Exceptional 1.6% |
| Estonians | 99.9 /100 | #44 | Exceptional 1.6% |
| Czechoslovakians | 99.9 /100 | #45 | Exceptional 1.6% |
Demographics Similar to Argentineans by No Schooling Completed
In terms of no schooling completed, the demographic groups most similar to Argentineans are Apache (2.1%, a difference of 0.090%), Immigrants from Poland (2.1%, a difference of 0.11%), Cheyenne (2.1%, a difference of 0.36%), Egyptian (2.1%, a difference of 0.44%), and Immigrants from Argentina (2.1%, a difference of 0.45%).
| Demographics | Rating | Rank | No Schooling Completed |
| Albanians | 62.2 /100 | #163 | Good 2.1% |
| Comanche | 60.7 /100 | #164 | Good 2.1% |
| Brazilians | 60.2 /100 | #165 | Good 2.1% |
| Dutch West Indians | 59.9 /100 | #166 | Average 2.1% |
| Egyptians | 59.2 /100 | #167 | Average 2.1% |
| Cheyenne | 58.6 /100 | #168 | Average 2.1% |
| Apache | 56.7 /100 | #169 | Average 2.1% |
| Argentineans | 56.0 /100 | #170 | Average 2.1% |
| Immigrants | Poland | 55.2 /100 | #171 | Average 2.1% |
| Immigrants | Argentina | 52.7 /100 | #172 | Average 2.1% |
| Immigrants | Belarus | 51.8 /100 | #173 | Average 2.1% |
| Immigrants | Micronesia | 50.0 /100 | #174 | Average 2.1% |
| Arabs | 46.4 /100 | #175 | Average 2.1% |
| Panamanians | 45.2 /100 | #176 | Average 2.1% |
| Arapaho | 45.0 /100 | #177 | Average 2.1% |