Osage vs Ghanaian 1st Grade
COMPARE
Osage
Ghanaian
1st Grade
1st Grade Comparison
Osage
Ghanaians
98.3%
1ST GRADE
99.2/ 100
METRIC RATING
80th/ 347
METRIC RANK
97.4%
1ST GRADE
0.1/ 100
METRIC RATING
274th/ 347
METRIC RANK
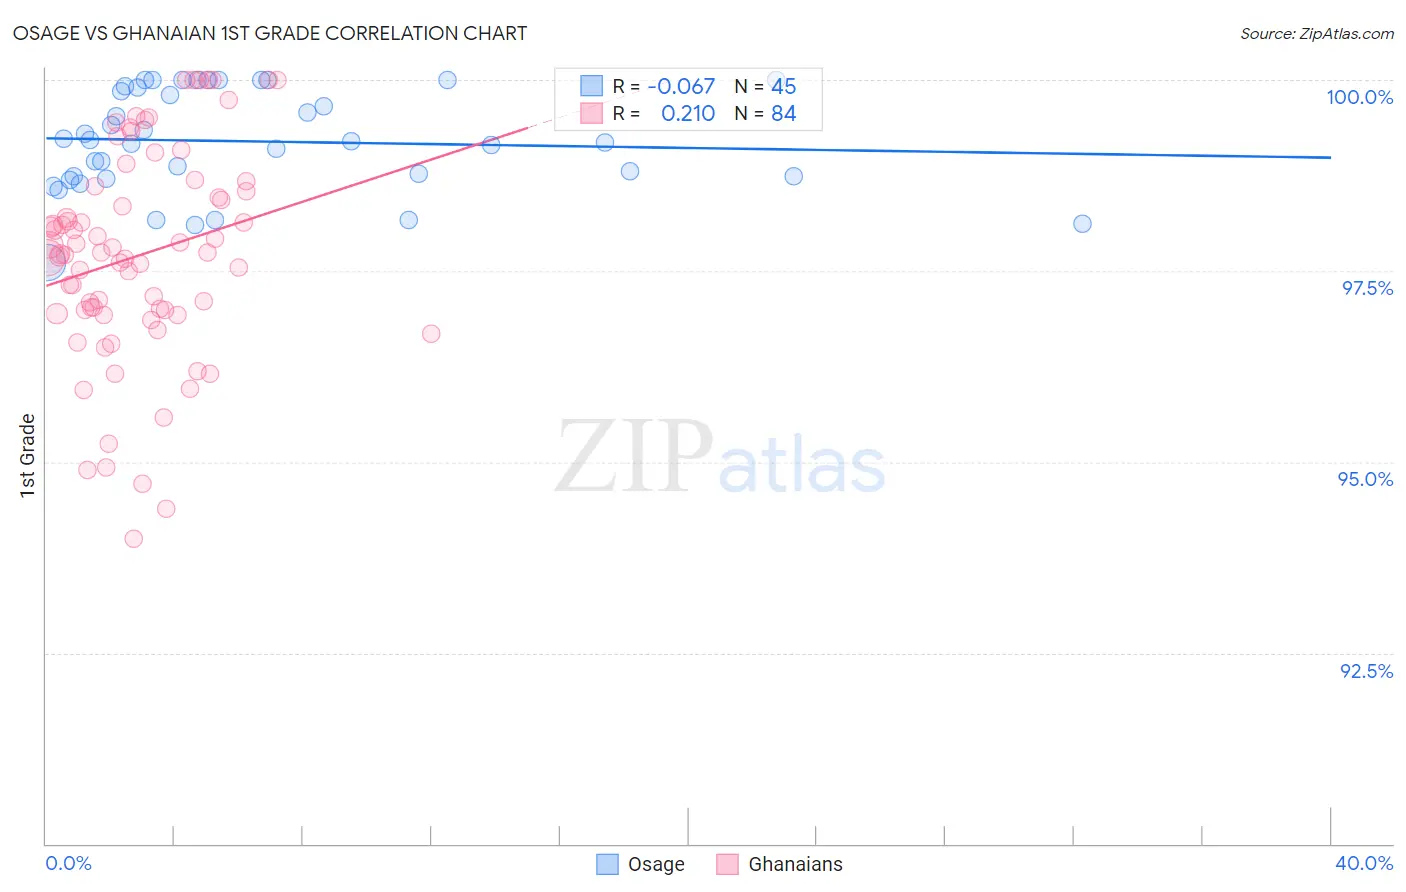
Osage vs Ghanaian 1st Grade Correlation Chart
The statistical analysis conducted on geographies consisting of 91,808,929 people shows a slight negative correlation between the proportion of Osage and percentage of population with at least 1st grade education in the United States with a correlation coefficient (R) of -0.067 and weighted average of 98.3%. Similarly, the statistical analysis conducted on geographies consisting of 190,712,873 people shows a weak positive correlation between the proportion of Ghanaians and percentage of population with at least 1st grade education in the United States with a correlation coefficient (R) of 0.210 and weighted average of 97.4%, a difference of 0.90%.
1st Grade Correlation Summary
| Measurement | Osage | Ghanaian |
| Minimum | 97.6% | 94.0% |
| Maximum | 100.0% | 100.0% |
| Range | 2.4% | 6.0% |
| Mean | 99.2% | 97.7% |
| Median | 99.2% | 97.7% |
| Interquartile 25% (IQ1) | 98.7% | 97.0% |
| Interquartile 75% (IQ3) | 99.9% | 98.6% |
| Interquartile Range (IQR) | 1.2% | 1.6% |
| Standard Deviation (Sample) | 0.66% | 1.4% |
| Standard Deviation (Population) | 0.66% | 1.4% |
Similar Demographics by 1st Grade
Demographics Similar to Osage by 1st Grade
In terms of 1st grade, the demographic groups most similar to Osage are Immigrants from Lithuania (98.3%, a difference of 0.0%), Potawatomi (98.3%, a difference of 0.0%), Icelander (98.3%, a difference of 0.0%), Immigrants from England (98.3%, a difference of 0.010%), and Immigrants from Belgium (98.3%, a difference of 0.010%).
| Demographics | Rating | Rank | 1st Grade |
| Cajuns | 99.5 /100 | #73 | Exceptional 98.3% |
| Immigrants | Netherlands | 99.4 /100 | #74 | Exceptional 98.3% |
| Cherokee | 99.3 /100 | #75 | Exceptional 98.3% |
| Shoshone | 99.3 /100 | #76 | Exceptional 98.3% |
| Immigrants | England | 99.3 /100 | #77 | Exceptional 98.3% |
| Immigrants | Belgium | 99.2 /100 | #78 | Exceptional 98.3% |
| Immigrants | Lithuania | 99.2 /100 | #79 | Exceptional 98.3% |
| Osage | 99.2 /100 | #80 | Exceptional 98.3% |
| Potawatomi | 99.1 /100 | #81 | Exceptional 98.3% |
| Icelanders | 99.1 /100 | #82 | Exceptional 98.3% |
| Immigrants | Sweden | 99.1 /100 | #83 | Exceptional 98.3% |
| Delaware | 99.1 /100 | #84 | Exceptional 98.3% |
| Hopi | 99.0 /100 | #85 | Exceptional 98.3% |
| Immigrants | Denmark | 99.0 /100 | #86 | Exceptional 98.3% |
| Immigrants | Australia | 99.0 /100 | #87 | Exceptional 98.3% |
Demographics Similar to Ghanaians by 1st Grade
In terms of 1st grade, the demographic groups most similar to Ghanaians are Immigrants from China (97.4%, a difference of 0.0%), Immigrants from Philippines (97.4%, a difference of 0.020%), Immigrants from Cameroon (97.4%, a difference of 0.030%), Immigrants from Peru (97.4%, a difference of 0.030%), and Immigrants from Bolivia (97.4%, a difference of 0.030%).
| Demographics | Rating | Rank | 1st Grade |
| Immigrants | Sierra Leone | 0.3 /100 | #267 | Tragic 97.5% |
| Immigrants | Nigeria | 0.3 /100 | #268 | Tragic 97.5% |
| West Indians | 0.3 /100 | #269 | Tragic 97.5% |
| Immigrants | Jamaica | 0.2 /100 | #270 | Tragic 97.5% |
| Immigrants | Cameroon | 0.2 /100 | #271 | Tragic 97.4% |
| Immigrants | Peru | 0.2 /100 | #272 | Tragic 97.4% |
| Immigrants | Bolivia | 0.2 /100 | #273 | Tragic 97.4% |
| Ghanaians | 0.1 /100 | #274 | Tragic 97.4% |
| Immigrants | China | 0.1 /100 | #275 | Tragic 97.4% |
| Immigrants | Philippines | 0.1 /100 | #276 | Tragic 97.4% |
| Immigrants | Western Africa | 0.1 /100 | #277 | Tragic 97.4% |
| Immigrants | Uzbekistan | 0.1 /100 | #278 | Tragic 97.4% |
| Immigrants | Ghana | 0.1 /100 | #279 | Tragic 97.4% |
| Afghans | 0.1 /100 | #280 | Tragic 97.4% |
| Trinidadians and Tobagonians | 0.1 /100 | #281 | Tragic 97.3% |