Peruvian vs Malaysian 12th Grade, No Diploma
COMPARE
Peruvian
Malaysian
12th Grade, No Diploma
12th Grade, No Diploma Comparison
Peruvians
Malaysians
90.2%
12TH GRADE, NO DIPLOMA
2.7/ 100
METRIC RATING
231st/ 347
METRIC RANK
89.2%
12TH GRADE, NO DIPLOMA
0.1/ 100
METRIC RATING
272nd/ 347
METRIC RANK
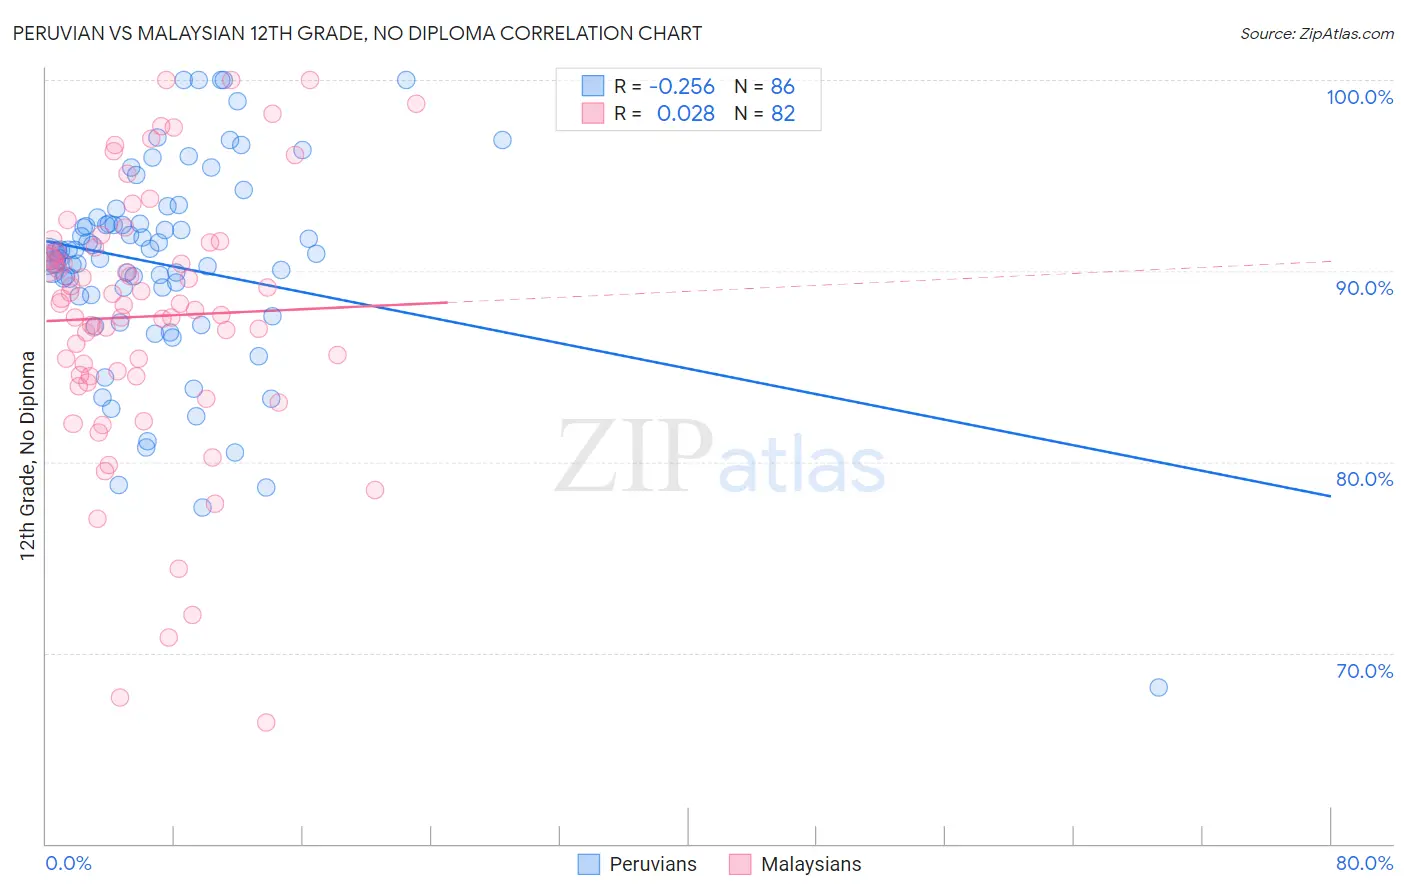
Peruvian vs Malaysian 12th Grade, No Diploma Correlation Chart
The statistical analysis conducted on geographies consisting of 363,251,075 people shows a weak negative correlation between the proportion of Peruvians and percentage of population with at least 12th grade (no diploma) education in the United States with a correlation coefficient (R) of -0.256 and weighted average of 90.2%. Similarly, the statistical analysis conducted on geographies consisting of 226,109,984 people shows no correlation between the proportion of Malaysians and percentage of population with at least 12th grade (no diploma) education in the United States with a correlation coefficient (R) of 0.028 and weighted average of 89.2%, a difference of 1.0%.
12th Grade, No Diploma Correlation Summary
| Measurement | Peruvian | Malaysian |
| Minimum | 68.2% | 66.4% |
| Maximum | 100.0% | 100.0% |
| Range | 31.8% | 33.6% |
| Mean | 90.3% | 87.6% |
| Median | 90.9% | 88.2% |
| Interquartile 25% (IQ1) | 88.7% | 84.5% |
| Interquartile 75% (IQ3) | 92.5% | 91.2% |
| Interquartile Range (IQR) | 3.8% | 6.7% |
| Standard Deviation (Sample) | 5.5% | 6.9% |
| Standard Deviation (Population) | 5.5% | 6.8% |
Similar Demographics by 12th Grade, No Diploma
Demographics Similar to Peruvians by 12th Grade, No Diploma
In terms of 12th grade, no diploma, the demographic groups most similar to Peruvians are Immigrants from Philippines (90.2%, a difference of 0.010%), Blackfeet (90.1%, a difference of 0.030%), Immigrants from Thailand (90.1%, a difference of 0.050%), Immigrants from South America (90.1%, a difference of 0.050%), and Colville (90.1%, a difference of 0.050%).
| Demographics | Rating | Rank | 12th Grade, No Diploma |
| Immigrants | Panama | 4.8 /100 | #224 | Tragic 90.3% |
| Chickasaw | 4.8 /100 | #225 | Tragic 90.3% |
| Immigrants | Zaire | 4.6 /100 | #226 | Tragic 90.3% |
| Nigerians | 4.5 /100 | #227 | Tragic 90.3% |
| Creek | 3.9 /100 | #228 | Tragic 90.3% |
| Immigrants | Bahamas | 3.6 /100 | #229 | Tragic 90.2% |
| Immigrants | Philippines | 2.8 /100 | #230 | Tragic 90.2% |
| Peruvians | 2.7 /100 | #231 | Tragic 90.2% |
| Blackfeet | 2.4 /100 | #232 | Tragic 90.1% |
| Immigrants | Thailand | 2.3 /100 | #233 | Tragic 90.1% |
| Immigrants | South America | 2.3 /100 | #234 | Tragic 90.1% |
| Colville | 2.3 /100 | #235 | Tragic 90.1% |
| Immigrants | Uzbekistan | 2.2 /100 | #236 | Tragic 90.1% |
| Immigrants | Colombia | 2.1 /100 | #237 | Tragic 90.1% |
| Inupiat | 2.0 /100 | #238 | Tragic 90.1% |
Demographics Similar to Malaysians by 12th Grade, No Diploma
In terms of 12th grade, no diploma, the demographic groups most similar to Malaysians are Black/African American (89.3%, a difference of 0.010%), Bangladeshi (89.3%, a difference of 0.020%), U.S. Virgin Islander (89.3%, a difference of 0.060%), Immigrants from Trinidad and Tobago (89.3%, a difference of 0.10%), and Seminole (89.4%, a difference of 0.12%).
| Demographics | Rating | Rank | 12th Grade, No Diploma |
| Trinidadians and Tobagonians | 0.2 /100 | #265 | Tragic 89.4% |
| Seminole | 0.2 /100 | #266 | Tragic 89.4% |
| West Indians | 0.2 /100 | #267 | Tragic 89.3% |
| Immigrants | Trinidad and Tobago | 0.1 /100 | #268 | Tragic 89.3% |
| U.S. Virgin Islanders | 0.1 /100 | #269 | Tragic 89.3% |
| Bangladeshis | 0.1 /100 | #270 | Tragic 89.3% |
| Blacks/African Americans | 0.1 /100 | #271 | Tragic 89.3% |
| Malaysians | 0.1 /100 | #272 | Tragic 89.2% |
| Barbadians | 0.1 /100 | #273 | Tragic 89.1% |
| Cajuns | 0.1 /100 | #274 | Tragic 89.1% |
| Immigrants | Congo | 0.1 /100 | #275 | Tragic 89.0% |
| Ute | 0.1 /100 | #276 | Tragic 89.0% |
| Immigrants | Barbados | 0.0 /100 | #277 | Tragic 89.0% |
| Immigrants | St. Vincent and the Grenadines | 0.0 /100 | #278 | Tragic 88.9% |
| Immigrants | Laos | 0.0 /100 | #279 | Tragic 88.9% |