Russian vs Inupiat Professional Degree
COMPARE
Russian
Inupiat
Professional Degree
Professional Degree Comparison
Russians
Inupiat
6.3%
PROFESSIONAL DEGREE
100.0/ 100
METRIC RATING
23rd/ 347
METRIC RANK
3.2%
PROFESSIONAL DEGREE
0.0/ 100
METRIC RATING
323rd/ 347
METRIC RANK
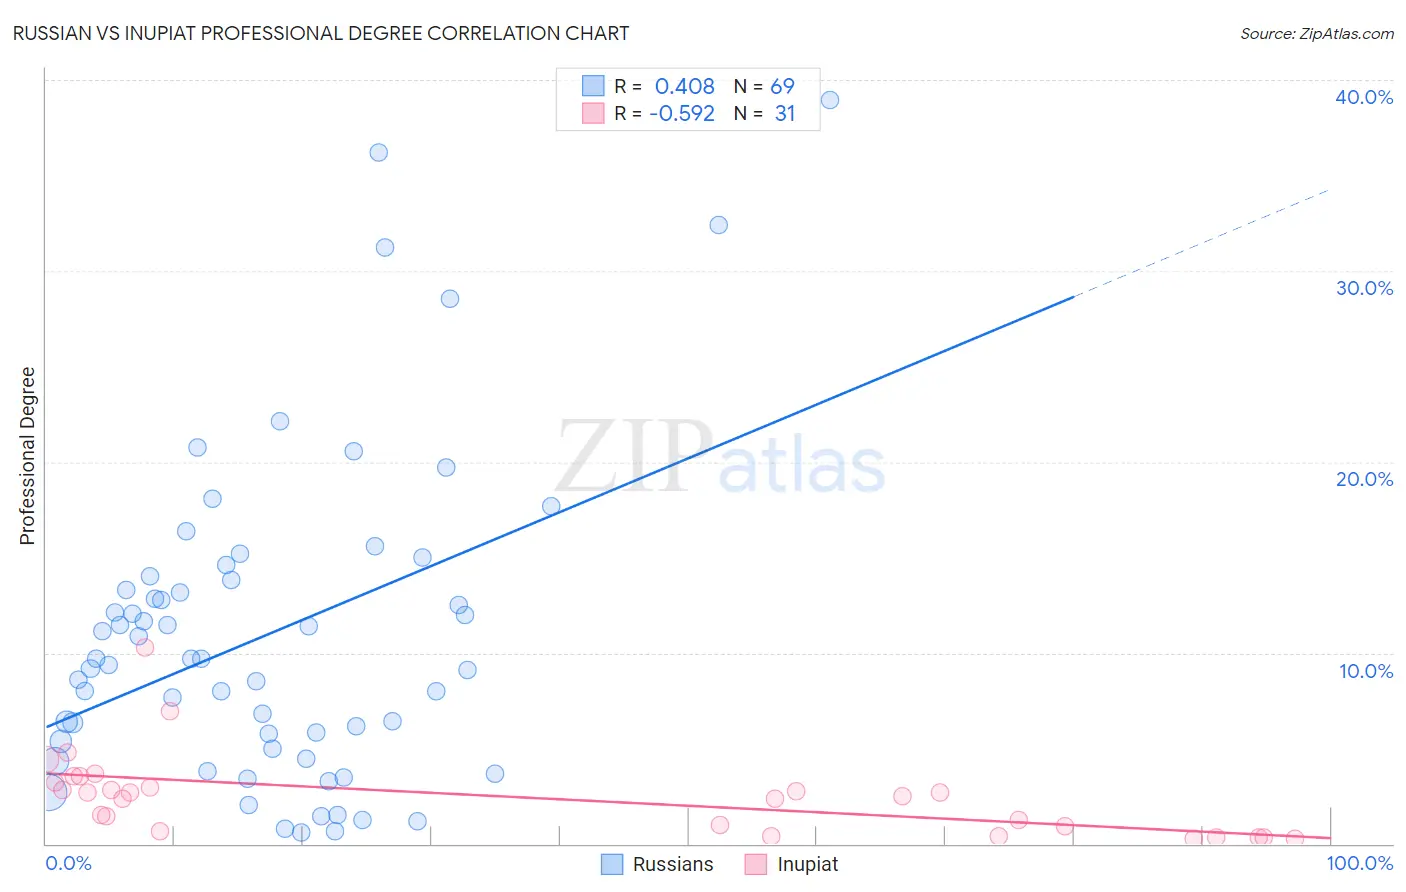
Russian vs Inupiat Professional Degree Correlation Chart
The statistical analysis conducted on geographies consisting of 509,341,332 people shows a moderate positive correlation between the proportion of Russians and percentage of population with at least professional degree education in the United States with a correlation coefficient (R) of 0.408 and weighted average of 6.3%. Similarly, the statistical analysis conducted on geographies consisting of 96,206,613 people shows a substantial negative correlation between the proportion of Inupiat and percentage of population with at least professional degree education in the United States with a correlation coefficient (R) of -0.592 and weighted average of 3.2%, a difference of 100.0%.
Professional Degree Correlation Summary
| Measurement | Russian | Inupiat |
| Minimum | 0.56% | 0.27% |
| Maximum | 39.0% | 10.3% |
| Range | 38.4% | 10.0% |
| Mean | 11.0% | 2.4% |
| Median | 9.7% | 2.5% |
| Interquartile 25% (IQ1) | 5.2% | 0.64% |
| Interquartile 75% (IQ3) | 13.9% | 3.2% |
| Interquartile Range (IQR) | 8.7% | 2.6% |
| Standard Deviation (Sample) | 8.3% | 2.1% |
| Standard Deviation (Population) | 8.3% | 2.1% |
Similar Demographics by Professional Degree
Demographics Similar to Russians by Professional Degree
In terms of professional degree, the demographic groups most similar to Russians are Immigrants from Spain (6.3%, a difference of 0.040%), Immigrants from Japan (6.4%, a difference of 0.48%), Immigrants from Ireland (6.3%, a difference of 0.53%), Immigrants from Hong Kong (6.4%, a difference of 1.2%), and Latvian (6.2%, a difference of 1.4%).
| Demographics | Rating | Rank | Professional Degree |
| Immigrants | Sweden | 100.0 /100 | #16 | Exceptional 6.7% |
| Immigrants | Eastern Asia | 100.0 /100 | #17 | Exceptional 6.6% |
| Soviet Union | 100.0 /100 | #18 | Exceptional 6.6% |
| Indians (Asian) | 100.0 /100 | #19 | Exceptional 6.5% |
| Immigrants | Denmark | 100.0 /100 | #20 | Exceptional 6.4% |
| Immigrants | Hong Kong | 100.0 /100 | #21 | Exceptional 6.4% |
| Immigrants | Japan | 100.0 /100 | #22 | Exceptional 6.4% |
| Russians | 100.0 /100 | #23 | Exceptional 6.3% |
| Immigrants | Spain | 100.0 /100 | #24 | Exceptional 6.3% |
| Immigrants | Ireland | 100.0 /100 | #25 | Exceptional 6.3% |
| Latvians | 100.0 /100 | #26 | Exceptional 6.2% |
| Immigrants | Northern Europe | 100.0 /100 | #27 | Exceptional 6.2% |
| Turks | 100.0 /100 | #28 | Exceptional 6.2% |
| Immigrants | Sri Lanka | 100.0 /100 | #29 | Exceptional 6.2% |
| Immigrants | Turkey | 100.0 /100 | #30 | Exceptional 6.2% |
Demographics Similar to Inupiat by Professional Degree
In terms of professional degree, the demographic groups most similar to Inupiat are Hispanic or Latino (3.2%, a difference of 0.080%), Crow (3.2%, a difference of 0.27%), Yaqui (3.2%, a difference of 0.34%), Tsimshian (3.2%, a difference of 0.44%), and Seminole (3.2%, a difference of 0.80%).
| Demographics | Rating | Rank | Professional Degree |
| Puerto Ricans | 0.1 /100 | #316 | Tragic 3.2% |
| Nepalese | 0.1 /100 | #317 | Tragic 3.2% |
| Immigrants | Micronesia | 0.1 /100 | #318 | Tragic 3.2% |
| Choctaw | 0.1 /100 | #319 | Tragic 3.2% |
| Seminole | 0.1 /100 | #320 | Tragic 3.2% |
| Tsimshian | 0.0 /100 | #321 | Tragic 3.2% |
| Hispanics or Latinos | 0.0 /100 | #322 | Tragic 3.2% |
| Inupiat | 0.0 /100 | #323 | Tragic 3.2% |
| Crow | 0.0 /100 | #324 | Tragic 3.2% |
| Yaqui | 0.0 /100 | #325 | Tragic 3.2% |
| Menominee | 0.0 /100 | #326 | Tragic 3.1% |
| Dutch West Indians | 0.0 /100 | #327 | Tragic 3.1% |
| Creek | 0.0 /100 | #328 | Tragic 3.1% |
| Bangladeshis | 0.0 /100 | #329 | Tragic 3.1% |
| Immigrants | Cabo Verde | 0.0 /100 | #330 | Tragic 3.1% |