Scandinavian vs Immigrants from St. Vincent and the Grenadines 5th Grade
COMPARE
Scandinavian
Immigrants from St. Vincent and the Grenadines
5th Grade
5th Grade Comparison
Scandinavians
Immigrants from St. Vincent and the Grenadines
98.2%
5TH GRADE
100.0/ 100
METRIC RATING
29th/ 347
METRIC RANK
96.6%
5TH GRADE
0.1/ 100
METRIC RATING
285th/ 347
METRIC RANK
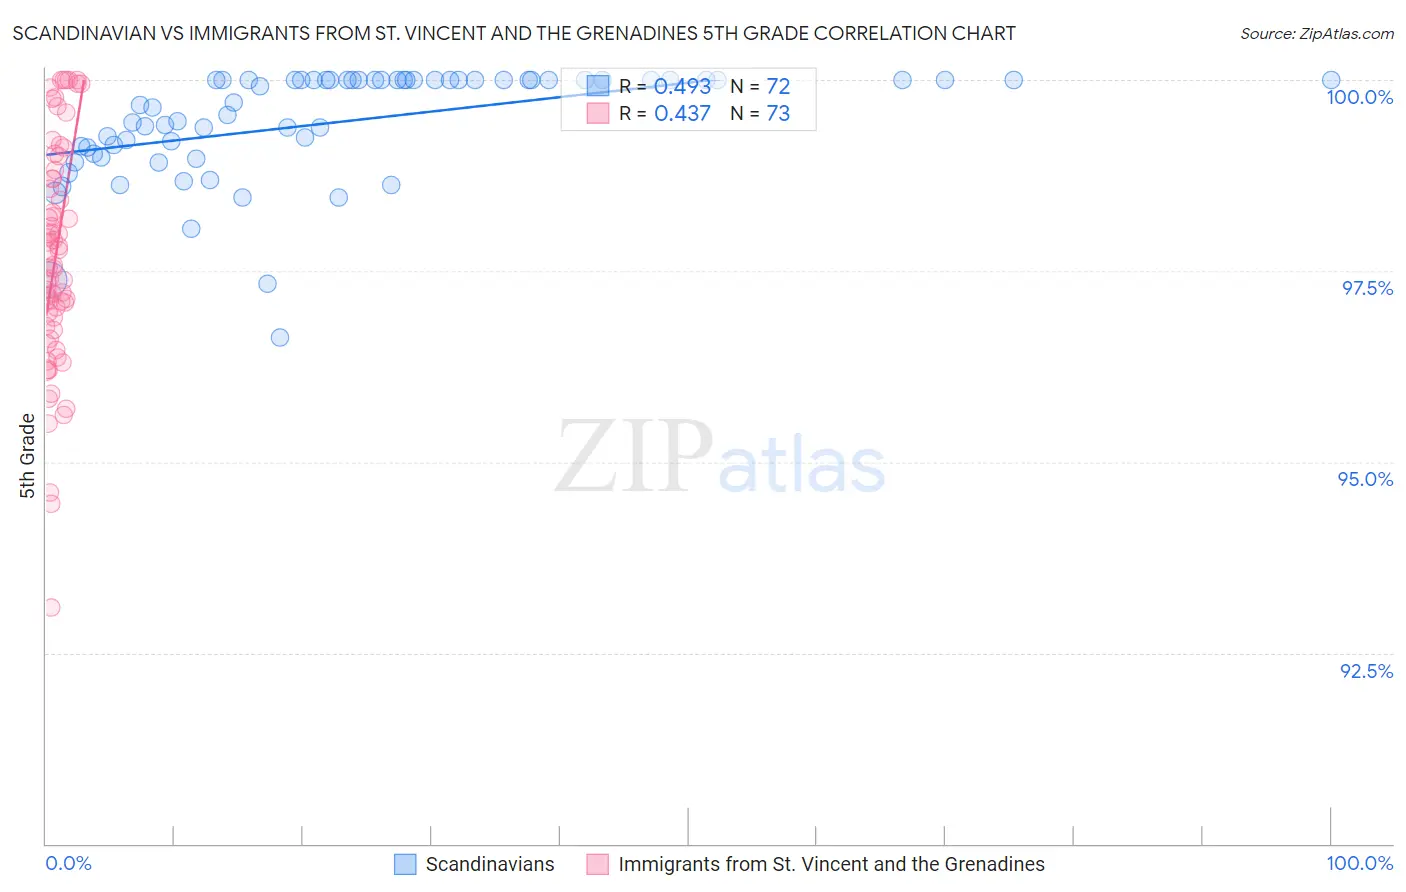
Scandinavian vs Immigrants from St. Vincent and the Grenadines 5th Grade Correlation Chart
The statistical analysis conducted on geographies consisting of 472,660,325 people shows a moderate positive correlation between the proportion of Scandinavians and percentage of population with at least 5th grade education in the United States with a correlation coefficient (R) of 0.493 and weighted average of 98.2%. Similarly, the statistical analysis conducted on geographies consisting of 56,191,418 people shows a moderate positive correlation between the proportion of Immigrants from St. Vincent and the Grenadines and percentage of population with at least 5th grade education in the United States with a correlation coefficient (R) of 0.437 and weighted average of 96.6%, a difference of 1.6%.
5th Grade Correlation Summary
| Measurement | Scandinavian | Immigrants from St. Vincent and the Grenadines |
| Minimum | 96.6% | 93.1% |
| Maximum | 100.0% | 100.0% |
| Range | 3.4% | 6.9% |
| Mean | 99.4% | 97.7% |
| Median | 99.8% | 97.6% |
| Interquartile 25% (IQ1) | 99.1% | 96.7% |
| Interquartile 75% (IQ3) | 100.0% | 98.8% |
| Interquartile Range (IQR) | 0.93% | 2.0% |
| Standard Deviation (Sample) | 0.73% | 1.5% |
| Standard Deviation (Population) | 0.73% | 1.5% |
Similar Demographics by 5th Grade
Demographics Similar to Scandinavians by 5th Grade
In terms of 5th grade, the demographic groups most similar to Scandinavians are French Canadian (98.2%, a difference of 0.0%), French (98.2%, a difference of 0.010%), Czech (98.2%, a difference of 0.010%), European (98.2%, a difference of 0.010%), and Yup'ik (98.2%, a difference of 0.020%).
| Demographics | Rating | Rank | 5th Grade |
| Croatians | 100.0 /100 | #22 | Exceptional 98.2% |
| Sioux | 100.0 /100 | #23 | Exceptional 98.2% |
| Scotch-Irish | 100.0 /100 | #24 | Exceptional 98.2% |
| Yup'ik | 100.0 /100 | #25 | Exceptional 98.2% |
| Alaska Natives | 100.0 /100 | #26 | Exceptional 98.2% |
| French | 100.0 /100 | #27 | Exceptional 98.2% |
| Czechs | 100.0 /100 | #28 | Exceptional 98.2% |
| Scandinavians | 100.0 /100 | #29 | Exceptional 98.2% |
| French Canadians | 100.0 /100 | #30 | Exceptional 98.2% |
| Europeans | 100.0 /100 | #31 | Exceptional 98.2% |
| Chippewa | 100.0 /100 | #32 | Exceptional 98.1% |
| Swiss | 100.0 /100 | #33 | Exceptional 98.1% |
| Chinese | 100.0 /100 | #34 | Exceptional 98.1% |
| Italians | 100.0 /100 | #35 | Exceptional 98.1% |
| British | 100.0 /100 | #36 | Exceptional 98.1% |
Demographics Similar to Immigrants from St. Vincent and the Grenadines by 5th Grade
In terms of 5th grade, the demographic groups most similar to Immigrants from St. Vincent and the Grenadines are Immigrants from Thailand (96.6%, a difference of 0.0%), Immigrants from Trinidad and Tobago (96.6%, a difference of 0.010%), Immigrants from Western Africa (96.6%, a difference of 0.020%), Houma (96.6%, a difference of 0.020%), and Barbadian (96.6%, a difference of 0.020%).
| Demographics | Rating | Rank | 5th Grade |
| Immigrants | Ghana | 0.1 /100 | #278 | Tragic 96.6% |
| Immigrants | Philippines | 0.1 /100 | #279 | Tragic 96.6% |
| Immigrants | Western Africa | 0.1 /100 | #280 | Tragic 96.6% |
| Houma | 0.1 /100 | #281 | Tragic 96.6% |
| Barbadians | 0.1 /100 | #282 | Tragic 96.6% |
| Fijians | 0.1 /100 | #283 | Tragic 96.6% |
| Immigrants | Trinidad and Tobago | 0.1 /100 | #284 | Tragic 96.6% |
| Immigrants | St. Vincent and the Grenadines | 0.1 /100 | #285 | Tragic 96.6% |
| Immigrants | Thailand | 0.1 /100 | #286 | Tragic 96.6% |
| Immigrants | Afghanistan | 0.1 /100 | #287 | Tragic 96.6% |
| Immigrants | Barbados | 0.0 /100 | #288 | Tragic 96.6% |
| Immigrants | West Indies | 0.0 /100 | #289 | Tragic 96.5% |
| British West Indians | 0.0 /100 | #290 | Tragic 96.5% |
| Malaysians | 0.0 /100 | #291 | Tragic 96.5% |
| Somalis | 0.0 /100 | #292 | Tragic 96.5% |