Seminole vs Immigrants from Guyana 7th Grade
COMPARE
Seminole
Immigrants from Guyana
7th Grade
7th Grade Comparison
Seminole
Immigrants from Guyana
96.2%
7TH GRADE
78.1/ 100
METRIC RATING
153rd/ 347
METRIC RANK
94.2%
7TH GRADE
0.0/ 100
METRIC RATING
306th/ 347
METRIC RANK
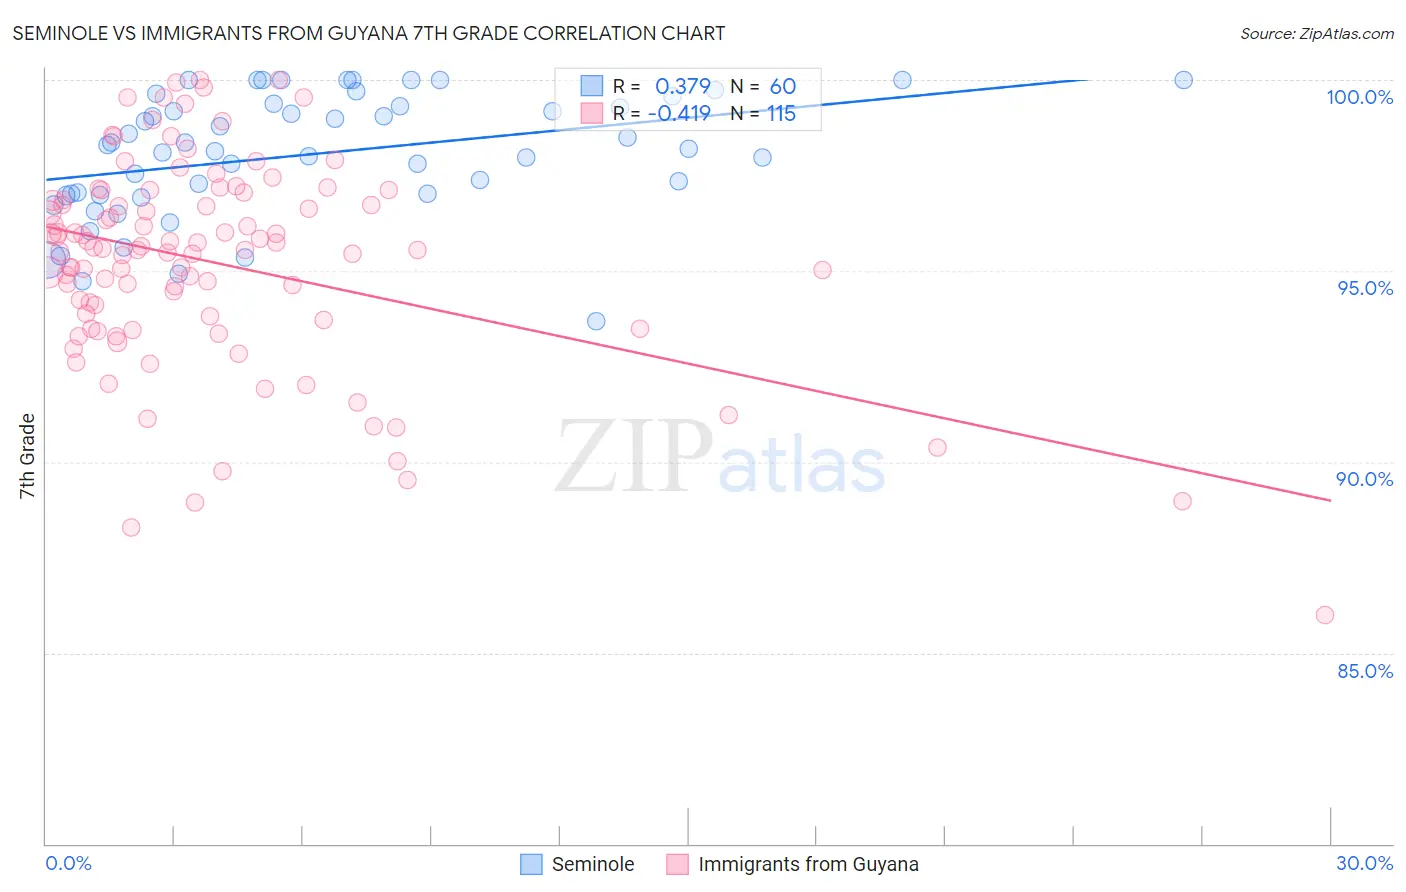
Seminole vs Immigrants from Guyana 7th Grade Correlation Chart
The statistical analysis conducted on geographies consisting of 118,314,162 people shows a mild positive correlation between the proportion of Seminole and percentage of population with at least 7th grade education in the United States with a correlation coefficient (R) of 0.379 and weighted average of 96.2%. Similarly, the statistical analysis conducted on geographies consisting of 183,673,461 people shows a moderate negative correlation between the proportion of Immigrants from Guyana and percentage of population with at least 7th grade education in the United States with a correlation coefficient (R) of -0.419 and weighted average of 94.2%, a difference of 2.1%.
7th Grade Correlation Summary
| Measurement | Seminole | Immigrants from Guyana |
| Minimum | 93.7% | 86.0% |
| Maximum | 100.0% | 100.0% |
| Range | 6.3% | 14.0% |
| Mean | 98.1% | 95.2% |
| Median | 98.3% | 95.5% |
| Interquartile 25% (IQ1) | 97.0% | 93.7% |
| Interquartile 75% (IQ3) | 99.4% | 96.9% |
| Interquartile Range (IQR) | 2.4% | 3.1% |
| Standard Deviation (Sample) | 1.6% | 2.7% |
| Standard Deviation (Population) | 1.6% | 2.7% |
Similar Demographics by 7th Grade
Demographics Similar to Seminole by 7th Grade
In terms of 7th grade, the demographic groups most similar to Seminole are Immigrants from Russia (96.2%, a difference of 0.0%), Immigrants from Israel (96.2%, a difference of 0.0%), Immigrants from Jordan (96.2%, a difference of 0.010%), Kenyan (96.2%, a difference of 0.020%), and Ugandan (96.2%, a difference of 0.020%).
| Demographics | Rating | Rank | 7th Grade |
| Immigrants | Eastern Europe | 83.7 /100 | #146 | Excellent 96.3% |
| French American Indians | 83.1 /100 | #147 | Excellent 96.3% |
| Israelis | 82.8 /100 | #148 | Excellent 96.3% |
| Albanians | 82.6 /100 | #149 | Excellent 96.3% |
| Immigrants | Belarus | 82.4 /100 | #150 | Excellent 96.3% |
| Hopi | 81.6 /100 | #151 | Excellent 96.3% |
| Immigrants | Russia | 78.4 /100 | #152 | Good 96.2% |
| Seminole | 78.1 /100 | #153 | Good 96.2% |
| Immigrants | Israel | 77.6 /100 | #154 | Good 96.2% |
| Immigrants | Jordan | 77.0 /100 | #155 | Good 96.2% |
| Kenyans | 76.2 /100 | #156 | Good 96.2% |
| Ugandans | 75.5 /100 | #157 | Good 96.2% |
| Arabs | 68.6 /100 | #158 | Good 96.2% |
| Alsatians | 67.2 /100 | #159 | Good 96.1% |
| Immigrants | Kenya | 66.8 /100 | #160 | Good 96.1% |
Demographics Similar to Immigrants from Guyana by 7th Grade
In terms of 7th grade, the demographic groups most similar to Immigrants from Guyana are Immigrants from Portugal (94.2%, a difference of 0.020%), Cape Verdean (94.1%, a difference of 0.10%), Guyanese (94.3%, a difference of 0.13%), Immigrants from Haiti (94.3%, a difference of 0.15%), and Ecuadorian (94.0%, a difference of 0.16%).
| Demographics | Rating | Rank | 7th Grade |
| Bangladeshis | 0.0 /100 | #299 | Tragic 94.5% |
| Immigrants | Burma/Myanmar | 0.0 /100 | #300 | Tragic 94.5% |
| Immigrants | Dominica | 0.0 /100 | #301 | Tragic 94.5% |
| Immigrants | Laos | 0.0 /100 | #302 | Tragic 94.5% |
| Sri Lankans | 0.0 /100 | #303 | Tragic 94.4% |
| Immigrants | Haiti | 0.0 /100 | #304 | Tragic 94.3% |
| Guyanese | 0.0 /100 | #305 | Tragic 94.3% |
| Immigrants | Guyana | 0.0 /100 | #306 | Tragic 94.2% |
| Immigrants | Portugal | 0.0 /100 | #307 | Tragic 94.2% |
| Cape Verdeans | 0.0 /100 | #308 | Tragic 94.1% |
| Ecuadorians | 0.0 /100 | #309 | Tragic 94.0% |
| Immigrants | Caribbean | 0.0 /100 | #310 | Tragic 94.0% |
| Puerto Ricans | 0.0 /100 | #311 | Tragic 94.0% |
| Immigrants | Immigrants | 0.0 /100 | #312 | Tragic 94.0% |
| Immigrants | Bangladesh | 0.0 /100 | #313 | Tragic 94.0% |