Slovene vs Immigrants from North America Professional Degree
COMPARE
Slovene
Immigrants from North America
Professional Degree
Professional Degree Comparison
Slovenes
Immigrants from North America
4.6%
PROFESSIONAL DEGREE
76.1/ 100
METRIC RATING
148th/ 347
METRIC RANK
5.3%
PROFESSIONAL DEGREE
99.7/ 100
METRIC RATING
79th/ 347
METRIC RANK
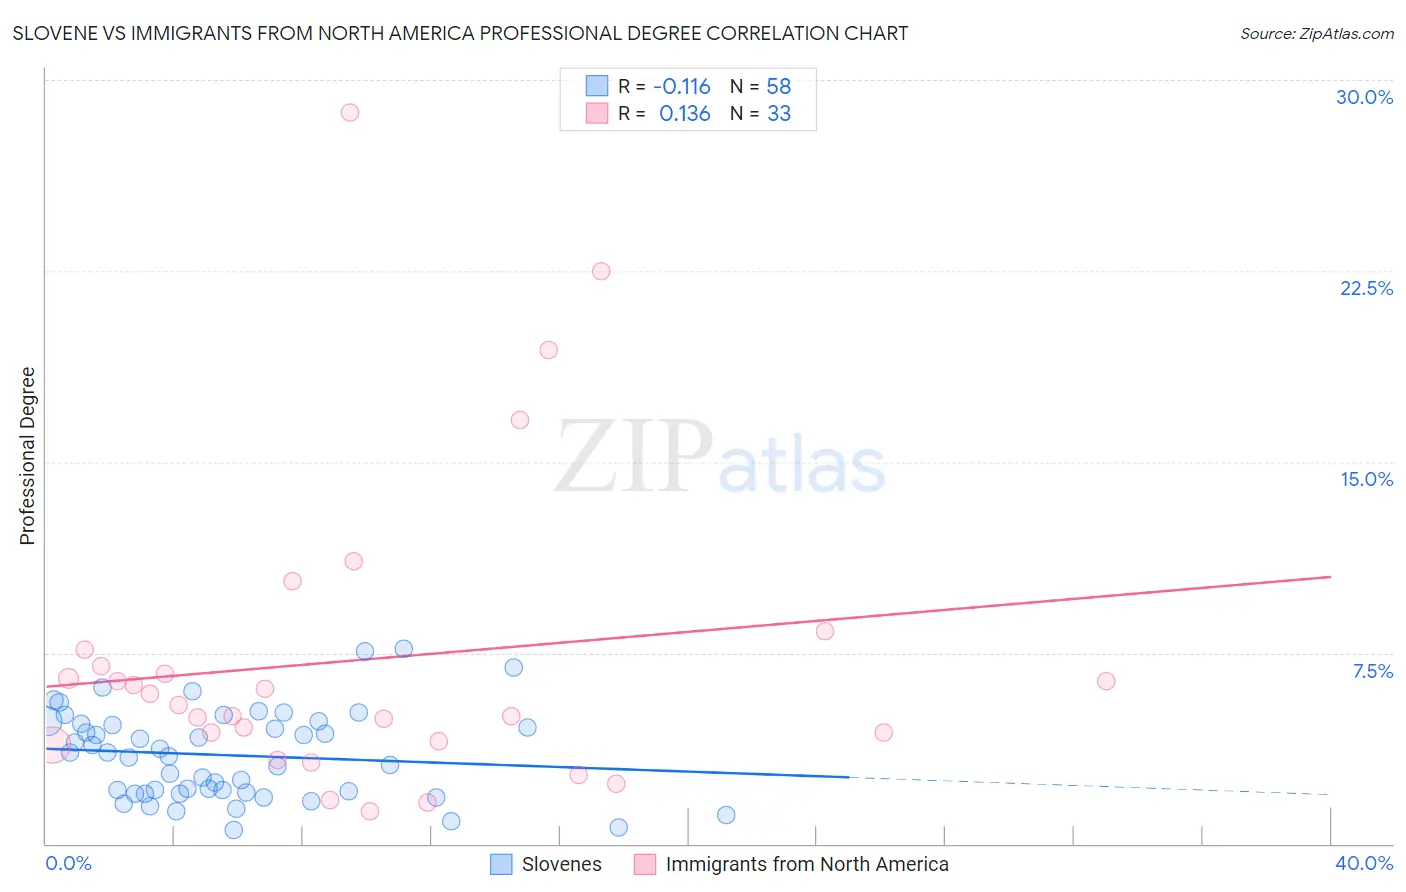
Slovene vs Immigrants from North America Professional Degree Correlation Chart
The statistical analysis conducted on geographies consisting of 260,948,724 people shows a poor negative correlation between the proportion of Slovenes and percentage of population with at least professional degree education in the United States with a correlation coefficient (R) of -0.116 and weighted average of 4.6%. Similarly, the statistical analysis conducted on geographies consisting of 460,954,091 people shows a poor positive correlation between the proportion of Immigrants from North America and percentage of population with at least professional degree education in the United States with a correlation coefficient (R) of 0.136 and weighted average of 5.3%, a difference of 16.1%.
Professional Degree Correlation Summary
| Measurement | Slovene | Immigrants from North America |
| Minimum | 0.52% | 1.3% |
| Maximum | 7.7% | 28.7% |
| Range | 7.2% | 27.4% |
| Mean | 3.5% | 7.2% |
| Median | 3.5% | 5.5% |
| Interquartile 25% (IQ1) | 2.0% | 3.9% |
| Interquartile 75% (IQ3) | 4.7% | 7.3% |
| Interquartile Range (IQR) | 2.7% | 3.3% |
| Standard Deviation (Sample) | 1.7% | 6.1% |
| Standard Deviation (Population) | 1.7% | 6.0% |
Similar Demographics by Professional Degree
Demographics Similar to Slovenes by Professional Degree
In terms of professional degree, the demographic groups most similar to Slovenes are Senegalese (4.6%, a difference of 0.14%), Colombian (4.6%, a difference of 0.32%), Immigrants from Oceania (4.6%, a difference of 0.50%), Luxembourger (4.6%, a difference of 0.53%), and Polish (4.6%, a difference of 0.64%).
| Demographics | Rating | Rank | Professional Degree |
| Basques | 81.8 /100 | #141 | Excellent 4.6% |
| Sudanese | 81.3 /100 | #142 | Excellent 4.6% |
| Hungarians | 80.8 /100 | #143 | Excellent 4.6% |
| Immigrants | South America | 80.5 /100 | #144 | Excellent 4.6% |
| Uruguayans | 80.2 /100 | #145 | Excellent 4.6% |
| Luxembourgers | 78.7 /100 | #146 | Good 4.6% |
| Colombians | 77.7 /100 | #147 | Good 4.6% |
| Slovenes | 76.1 /100 | #148 | Good 4.6% |
| Senegalese | 75.3 /100 | #149 | Good 4.6% |
| Immigrants | Oceania | 73.4 /100 | #150 | Good 4.6% |
| Poles | 72.6 /100 | #151 | Good 4.6% |
| Immigrants | Africa | 72.5 /100 | #152 | Good 4.6% |
| Immigrants | Uruguay | 72.5 /100 | #153 | Good 4.6% |
| Scottish | 71.8 /100 | #154 | Good 4.6% |
| Slavs | 70.8 /100 | #155 | Good 4.5% |
Demographics Similar to Immigrants from North America by Professional Degree
In terms of professional degree, the demographic groups most similar to Immigrants from North America are Armenian (5.3%, a difference of 0.17%), Immigrants from Ethiopia (5.3%, a difference of 0.22%), Immigrants from Canada (5.3%, a difference of 0.26%), Immigrants from Indonesia (5.3%, a difference of 0.35%), and Immigrants from England (5.3%, a difference of 0.39%).
| Demographics | Rating | Rank | Professional Degree |
| Lithuanians | 99.8 /100 | #72 | Exceptional 5.4% |
| Immigrants | Romania | 99.8 /100 | #73 | Exceptional 5.4% |
| Ethiopians | 99.7 /100 | #74 | Exceptional 5.4% |
| Immigrants | Indonesia | 99.7 /100 | #75 | Exceptional 5.3% |
| Immigrants | Canada | 99.7 /100 | #76 | Exceptional 5.3% |
| Immigrants | Ethiopia | 99.7 /100 | #77 | Exceptional 5.3% |
| Armenians | 99.7 /100 | #78 | Exceptional 5.3% |
| Immigrants | North America | 99.7 /100 | #79 | Exceptional 5.3% |
| Immigrants | England | 99.6 /100 | #80 | Exceptional 5.3% |
| Immigrants | Brazil | 99.6 /100 | #81 | Exceptional 5.3% |
| Romanians | 99.6 /100 | #82 | Exceptional 5.3% |
| Carpatho Rusyns | 99.6 /100 | #83 | Exceptional 5.3% |
| Immigrants | Croatia | 99.6 /100 | #84 | Exceptional 5.3% |
| Immigrants | Zimbabwe | 99.6 /100 | #85 | Exceptional 5.3% |
| Greeks | 99.6 /100 | #86 | Exceptional 5.3% |