Slovene vs Japanese No Schooling Completed
COMPARE
Slovene
Japanese
No Schooling Completed
No Schooling Completed Comparison
Slovenes
Japanese
1.4%
NO SCHOOLING COMPLETED
100.0/ 100
METRIC RATING
5th/ 347
METRIC RANK
3.3%
NO SCHOOLING COMPLETED
0.0/ 100
METRIC RATING
331st/ 347
METRIC RANK
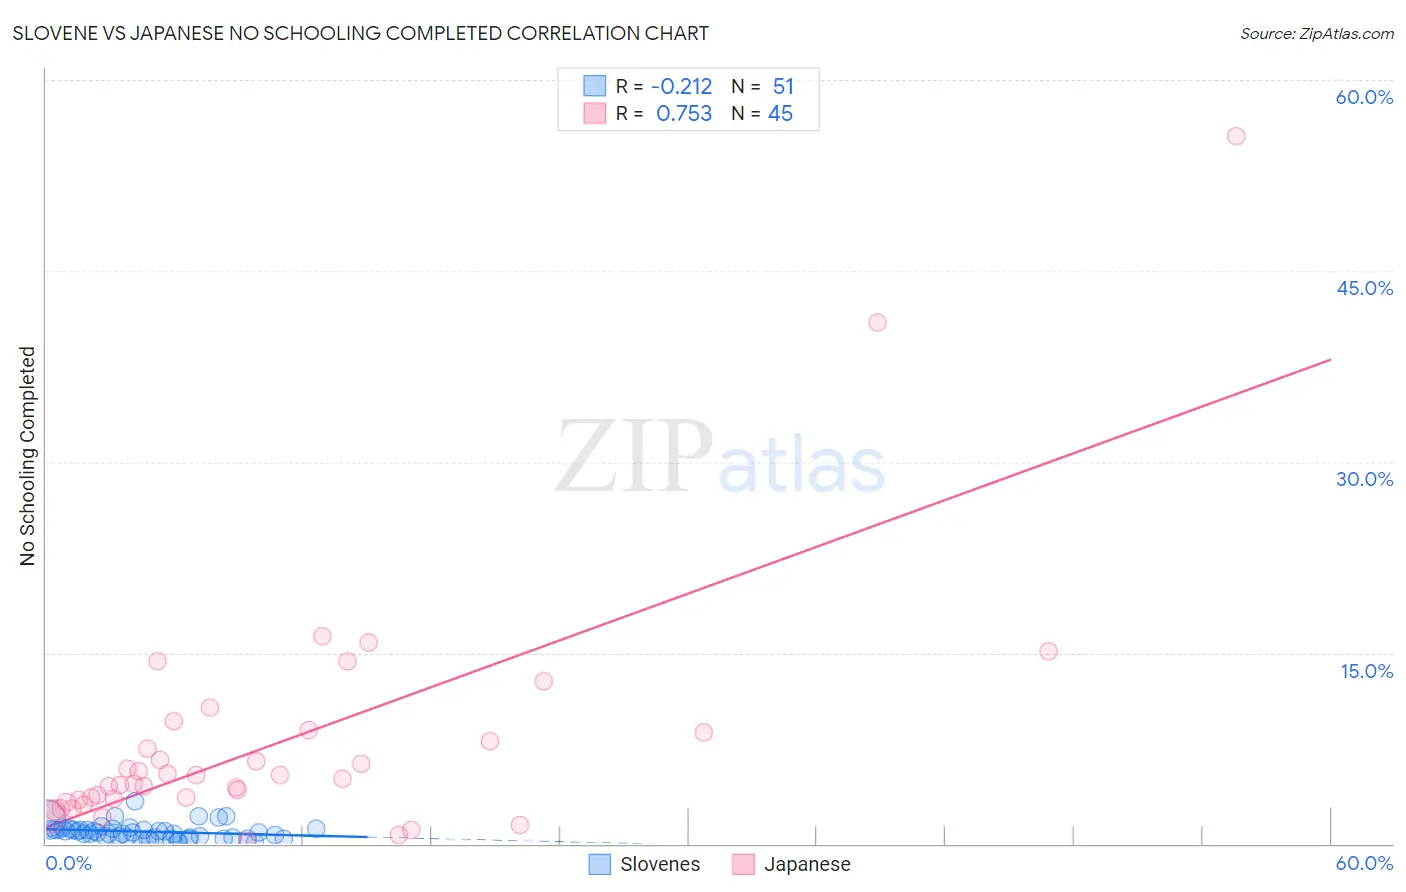
Slovene vs Japanese No Schooling Completed Correlation Chart
The statistical analysis conducted on geographies consisting of 258,600,541 people shows a weak negative correlation between the proportion of Slovenes and percentage of population with no schooling in the United States with a correlation coefficient (R) of -0.212 and weighted average of 1.4%. Similarly, the statistical analysis conducted on geographies consisting of 248,181,400 people shows a strong positive correlation between the proportion of Japanese and percentage of population with no schooling in the United States with a correlation coefficient (R) of 0.753 and weighted average of 3.3%, a difference of 145.8%.
No Schooling Completed Correlation Summary
| Measurement | Slovene | Japanese |
| Minimum | 0.14% | 0.20% |
| Maximum | 3.4% | 55.6% |
| Range | 3.2% | 55.4% |
| Mean | 0.95% | 8.0% |
| Median | 0.91% | 5.1% |
| Interquartile 25% (IQ1) | 0.51% | 3.3% |
| Interquartile 75% (IQ3) | 1.1% | 8.8% |
| Interquartile Range (IQR) | 0.62% | 5.5% |
| Standard Deviation (Sample) | 0.61% | 9.8% |
| Standard Deviation (Population) | 0.60% | 9.7% |
Similar Demographics by No Schooling Completed
Demographics Similar to Slovenes by No Schooling Completed
In terms of no schooling completed, the demographic groups most similar to Slovenes are German (1.4%, a difference of 0.42%), Carpatho Rusyn (1.4%, a difference of 0.82%), Norwegian (1.3%, a difference of 0.98%), Slovak (1.3%, a difference of 1.4%), and English (1.4%, a difference of 1.8%).
| Demographics | Rating | Rank | No Schooling Completed |
| Yup'ik | 100.0 /100 | #1 | Exceptional 1.2% |
| Slovaks | 100.0 /100 | #2 | Exceptional 1.3% |
| Norwegians | 100.0 /100 | #3 | Exceptional 1.3% |
| Germans | 100.0 /100 | #4 | Exceptional 1.4% |
| Slovenes | 100.0 /100 | #5 | Exceptional 1.4% |
| Carpatho Rusyns | 100.0 /100 | #6 | Exceptional 1.4% |
| English | 100.0 /100 | #7 | Exceptional 1.4% |
| Swedes | 100.0 /100 | #8 | Exceptional 1.4% |
| Scottish | 100.0 /100 | #9 | Exceptional 1.4% |
| Dutch | 100.0 /100 | #10 | Exceptional 1.4% |
| Lithuanians | 100.0 /100 | #11 | Exceptional 1.4% |
| Irish | 100.0 /100 | #12 | Exceptional 1.4% |
| Poles | 100.0 /100 | #13 | Exceptional 1.4% |
| Scotch-Irish | 100.0 /100 | #14 | Exceptional 1.5% |
| Tlingit-Haida | 100.0 /100 | #15 | Exceptional 1.5% |
Demographics Similar to Japanese by No Schooling Completed
In terms of no schooling completed, the demographic groups most similar to Japanese are Immigrants from Armenia (3.3%, a difference of 0.030%), Immigrants from Vietnam (3.3%, a difference of 0.45%), Central American (3.4%, a difference of 1.5%), Mexican (3.3%, a difference of 1.5%), and Immigrants from Dominican Republic (3.4%, a difference of 1.6%).
| Demographics | Rating | Rank | No Schooling Completed |
| Mexican American Indians | 0.0 /100 | #324 | Tragic 3.2% |
| Dominicans | 0.0 /100 | #325 | Tragic 3.2% |
| Indonesians | 0.0 /100 | #326 | Tragic 3.2% |
| Immigrants | Latin America | 0.0 /100 | #327 | Tragic 3.3% |
| Mexicans | 0.0 /100 | #328 | Tragic 3.3% |
| Immigrants | Vietnam | 0.0 /100 | #329 | Tragic 3.3% |
| Immigrants | Armenia | 0.0 /100 | #330 | Tragic 3.3% |
| Japanese | 0.0 /100 | #331 | Tragic 3.3% |
| Central Americans | 0.0 /100 | #332 | Tragic 3.4% |
| Immigrants | Dominican Republic | 0.0 /100 | #333 | Tragic 3.4% |
| Guatemalans | 0.0 /100 | #334 | Tragic 3.5% |
| Immigrants | Cambodia | 0.0 /100 | #335 | Tragic 3.5% |
| Immigrants | Fiji | 0.0 /100 | #336 | Tragic 3.5% |
| Immigrants | Cabo Verde | 0.0 /100 | #337 | Tragic 3.5% |
| Bangladeshis | 0.0 /100 | #338 | Tragic 3.5% |