Spanish vs Immigrants from Peru 3rd Grade
COMPARE
Spanish
Immigrants from Peru
3rd Grade
3rd Grade Comparison
Spanish
Immigrants from Peru
98.0%
3RD GRADE
94.8/ 100
METRIC RATING
119th/ 347
METRIC RANK
97.2%
3RD GRADE
0.1/ 100
METRIC RATING
273rd/ 347
METRIC RANK
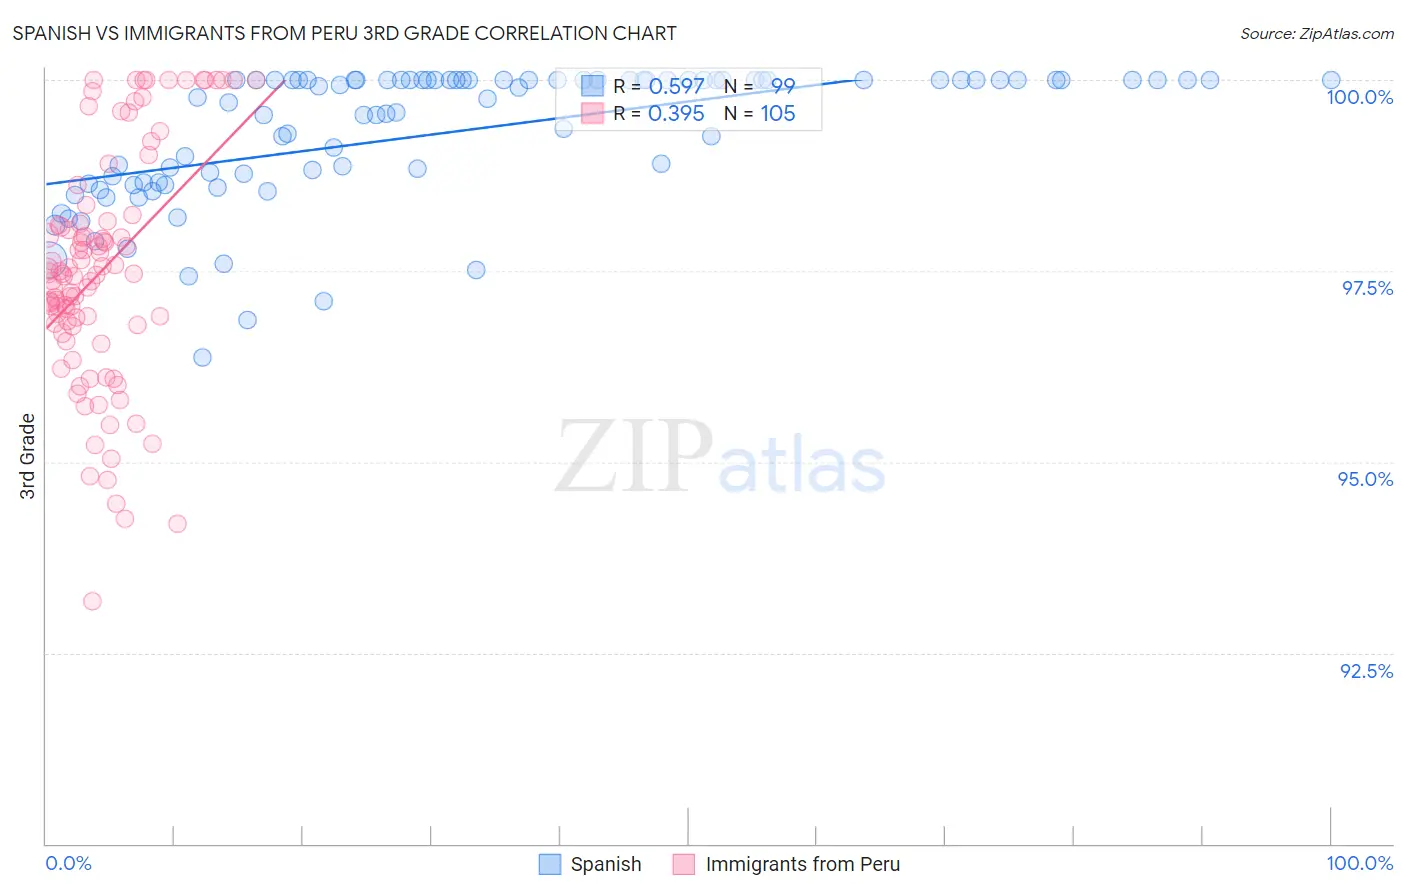
Spanish vs Immigrants from Peru 3rd Grade Correlation Chart
The statistical analysis conducted on geographies consisting of 422,189,210 people shows a substantial positive correlation between the proportion of Spanish and percentage of population with at least 3rd grade education in the United States with a correlation coefficient (R) of 0.597 and weighted average of 98.0%. Similarly, the statistical analysis conducted on geographies consisting of 328,685,754 people shows a mild positive correlation between the proportion of Immigrants from Peru and percentage of population with at least 3rd grade education in the United States with a correlation coefficient (R) of 0.395 and weighted average of 97.2%, a difference of 0.80%.
3rd Grade Correlation Summary
| Measurement | Spanish | Immigrants from Peru |
| Minimum | 96.4% | 93.2% |
| Maximum | 100.0% | 100.0% |
| Range | 3.6% | 6.8% |
| Mean | 99.3% | 97.5% |
| Median | 99.9% | 97.5% |
| Interquartile 25% (IQ1) | 98.7% | 96.8% |
| Interquartile 75% (IQ3) | 100.0% | 98.1% |
| Interquartile Range (IQR) | 1.3% | 1.3% |
| Standard Deviation (Sample) | 0.88% | 1.5% |
| Standard Deviation (Population) | 0.88% | 1.5% |
Similar Demographics by 3rd Grade
Demographics Similar to Spanish by 3rd Grade
In terms of 3rd grade, the demographic groups most similar to Spanish are Iranian (98.0%, a difference of 0.0%), Thai (98.0%, a difference of 0.010%), Menominee (98.0%, a difference of 0.010%), Okinawan (98.0%, a difference of 0.010%), and Immigrants from Norway (98.0%, a difference of 0.010%).
| Demographics | Rating | Rank | 3rd Grade |
| Immigrants | Latvia | 96.0 /100 | #112 | Exceptional 98.0% |
| Thais | 95.5 /100 | #113 | Exceptional 98.0% |
| Menominee | 95.4 /100 | #114 | Exceptional 98.0% |
| Okinawans | 95.2 /100 | #115 | Exceptional 98.0% |
| Immigrants | Norway | 95.2 /100 | #116 | Exceptional 98.0% |
| Immigrants | France | 95.1 /100 | #117 | Exceptional 98.0% |
| Iranians | 94.9 /100 | #118 | Exceptional 98.0% |
| Spanish | 94.8 /100 | #119 | Exceptional 98.0% |
| Immigrants | Croatia | 94.4 /100 | #120 | Exceptional 98.0% |
| Iroquois | 94.1 /100 | #121 | Exceptional 98.0% |
| Lebanese | 94.1 /100 | #122 | Exceptional 98.0% |
| Syrians | 93.8 /100 | #123 | Exceptional 98.0% |
| Immigrants | Japan | 93.7 /100 | #124 | Exceptional 98.0% |
| Immigrants | Saudi Arabia | 93.5 /100 | #125 | Exceptional 98.0% |
| Immigrants | Zimbabwe | 93.4 /100 | #126 | Exceptional 98.0% |
Demographics Similar to Immigrants from Peru by 3rd Grade
In terms of 3rd grade, the demographic groups most similar to Immigrants from Peru are Puerto Rican (97.2%, a difference of 0.0%), Ghanaian (97.2%, a difference of 0.0%), Immigrants from China (97.2%, a difference of 0.010%), Immigrants from Cameroon (97.2%, a difference of 0.010%), and Immigrants from Uzbekistan (97.2%, a difference of 0.030%).
| Demographics | Rating | Rank | 3rd Grade |
| Yaqui | 0.3 /100 | #266 | Tragic 97.3% |
| Immigrants | Nigeria | 0.3 /100 | #267 | Tragic 97.3% |
| Cubans | 0.2 /100 | #268 | Tragic 97.3% |
| Fijians | 0.2 /100 | #269 | Tragic 97.3% |
| Immigrants | China | 0.2 /100 | #270 | Tragic 97.2% |
| Puerto Ricans | 0.2 /100 | #271 | Tragic 97.2% |
| Ghanaians | 0.1 /100 | #272 | Tragic 97.2% |
| Immigrants | Peru | 0.1 /100 | #273 | Tragic 97.2% |
| Immigrants | Cameroon | 0.1 /100 | #274 | Tragic 97.2% |
| Immigrants | Uzbekistan | 0.1 /100 | #275 | Tragic 97.2% |
| Immigrants | Bolivia | 0.1 /100 | #276 | Tragic 97.2% |
| Trinidadians and Tobagonians | 0.1 /100 | #277 | Tragic 97.2% |
| Immigrants | Western Africa | 0.1 /100 | #278 | Tragic 97.2% |
| Immigrants | Philippines | 0.1 /100 | #279 | Tragic 97.2% |
| Immigrants | Ghana | 0.1 /100 | #280 | Tragic 97.2% |