Spanish vs Spanish American Indian 5th Grade
COMPARE
Spanish
Spanish American Indian
5th Grade
5th Grade Comparison
Spanish
Spanish American Indians
97.6%
5TH GRADE
93.7/ 100
METRIC RATING
124th/ 347
METRIC RANK
94.2%
5TH GRADE
0.0/ 100
METRIC RATING
347th/ 347
METRIC RANK
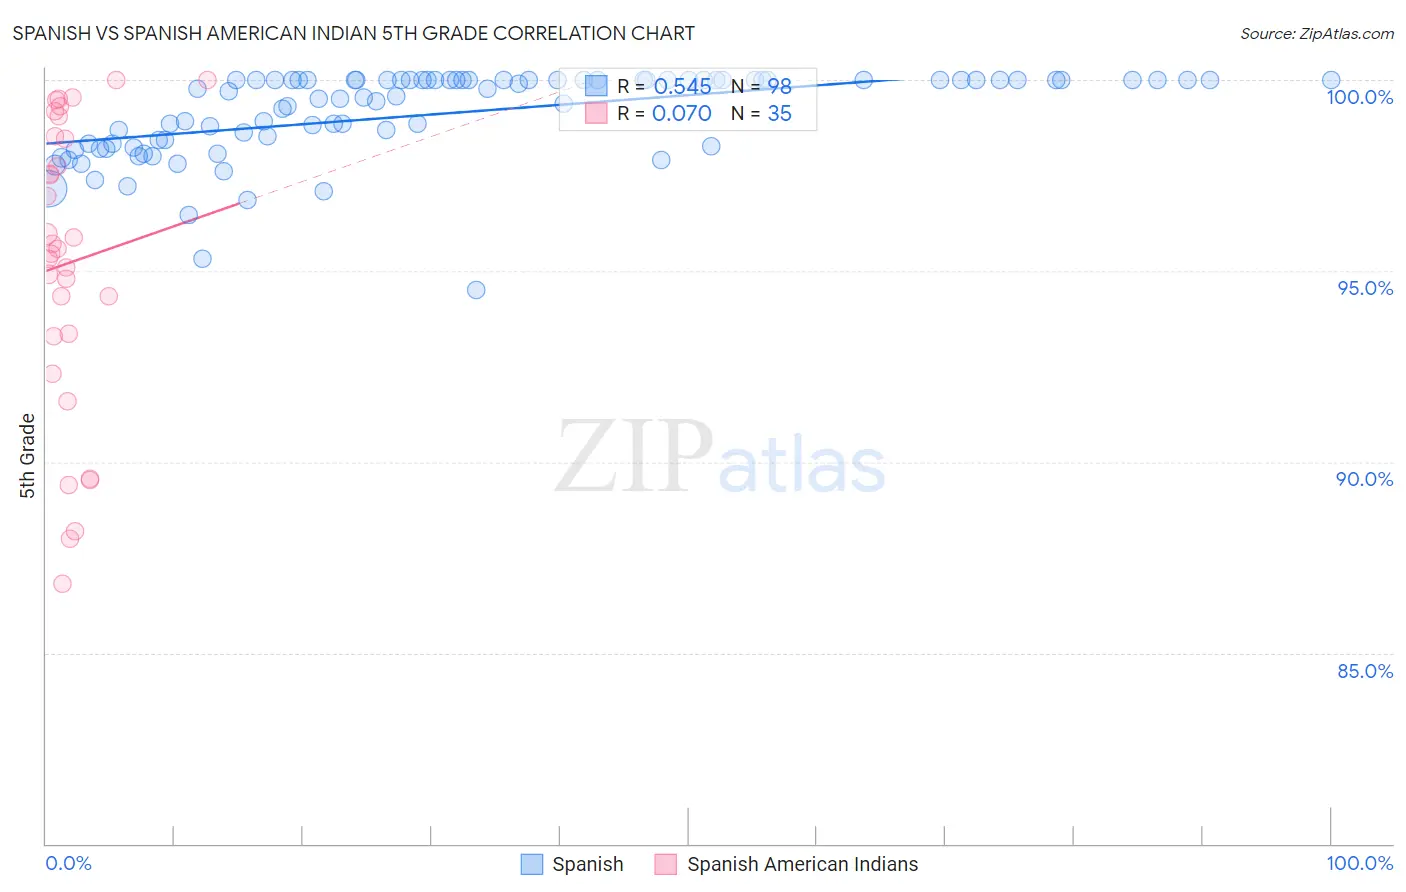
Spanish vs Spanish American Indian 5th Grade Correlation Chart
The statistical analysis conducted on geographies consisting of 422,189,188 people shows a substantial positive correlation between the proportion of Spanish and percentage of population with at least 5th grade education in the United States with a correlation coefficient (R) of 0.545 and weighted average of 97.6%. Similarly, the statistical analysis conducted on geographies consisting of 73,150,359 people shows a slight positive correlation between the proportion of Spanish American Indians and percentage of population with at least 5th grade education in the United States with a correlation coefficient (R) of 0.070 and weighted average of 94.2%, a difference of 3.6%.
5th Grade Correlation Summary
| Measurement | Spanish | Spanish American Indian |
| Minimum | 94.5% | 86.8% |
| Maximum | 100.0% | 100.0% |
| Range | 5.5% | 13.2% |
| Mean | 99.1% | 95.2% |
| Median | 99.7% | 95.6% |
| Interquartile 25% (IQ1) | 98.3% | 93.3% |
| Interquartile 75% (IQ3) | 100.0% | 98.5% |
| Interquartile Range (IQR) | 1.7% | 5.2% |
| Standard Deviation (Sample) | 1.1% | 3.8% |
| Standard Deviation (Population) | 1.1% | 3.8% |
Similar Demographics by 5th Grade
Demographics Similar to Spanish by 5th Grade
In terms of 5th grade, the demographic groups most similar to Spanish are Immigrants from Bulgaria (97.6%, a difference of 0.010%), Immigrants from Zimbabwe (97.6%, a difference of 0.020%), Immigrants from France (97.6%, a difference of 0.020%), Immigrants from Japan (97.6%, a difference of 0.020%), and Immigrants from Norway (97.6%, a difference of 0.020%).
| Demographics | Rating | Rank | 5th Grade |
| Immigrants | Saudi Arabia | 95.4 /100 | #117 | Exceptional 97.6% |
| Basques | 95.2 /100 | #118 | Exceptional 97.6% |
| Syrians | 95.1 /100 | #119 | Exceptional 97.6% |
| Immigrants | Zimbabwe | 94.9 /100 | #120 | Exceptional 97.6% |
| Immigrants | France | 94.8 /100 | #121 | Exceptional 97.6% |
| Immigrants | Japan | 94.7 /100 | #122 | Exceptional 97.6% |
| Immigrants | Norway | 94.6 /100 | #123 | Exceptional 97.6% |
| Spanish | 93.7 /100 | #124 | Exceptional 97.6% |
| Immigrants | Bulgaria | 93.1 /100 | #125 | Exceptional 97.6% |
| Hmong | 92.3 /100 | #126 | Exceptional 97.6% |
| Immigrants | Serbia | 92.3 /100 | #127 | Exceptional 97.6% |
| Colville | 92.0 /100 | #128 | Exceptional 97.6% |
| Immigrants | Europe | 91.9 /100 | #129 | Exceptional 97.6% |
| Immigrants | Romania | 91.6 /100 | #130 | Exceptional 97.6% |
| Pima | 91.2 /100 | #131 | Exceptional 97.6% |
Demographics Similar to Spanish American Indians by 5th Grade
In terms of 5th grade, the demographic groups most similar to Spanish American Indians are Immigrants from El Salvador (94.3%, a difference of 0.11%), Salvadoran (94.6%, a difference of 0.40%), Immigrants from Mexico (94.6%, a difference of 0.40%), Immigrants from Guatemala (94.6%, a difference of 0.40%), and Immigrants from Central America (94.7%, a difference of 0.46%).
| Demographics | Rating | Rank | 5th Grade |
| Immigrants | Latin America | 0.0 /100 | #333 | Tragic 95.3% |
| Nepalese | 0.0 /100 | #334 | Tragic 95.2% |
| Mexicans | 0.0 /100 | #335 | Tragic 95.2% |
| Immigrants | Azores | 0.0 /100 | #336 | Tragic 95.1% |
| Central Americans | 0.0 /100 | #337 | Tragic 95.1% |
| Immigrants | Cabo Verde | 0.0 /100 | #338 | Tragic 94.9% |
| Immigrants | Yemen | 0.0 /100 | #339 | Tragic 94.9% |
| Guatemalans | 0.0 /100 | #340 | Tragic 94.8% |
| Yakama | 0.0 /100 | #341 | Tragic 94.8% |
| Immigrants | Central America | 0.0 /100 | #342 | Tragic 94.7% |
| Salvadorans | 0.0 /100 | #343 | Tragic 94.6% |
| Immigrants | Mexico | 0.0 /100 | #344 | Tragic 94.6% |
| Immigrants | Guatemala | 0.0 /100 | #345 | Tragic 94.6% |
| Immigrants | El Salvador | 0.0 /100 | #346 | Tragic 94.3% |
| Spanish American Indians | 0.0 /100 | #347 | Tragic 94.2% |