Sudanese vs Immigrants from Congo 7th Grade
COMPARE
Sudanese
Immigrants from Congo
7th Grade
7th Grade Comparison
Sudanese
Immigrants from Congo
95.9%
7TH GRADE
28.1/ 100
METRIC RATING
195th/ 347
METRIC RANK
95.3%
7TH GRADE
0.7/ 100
METRIC RATING
257th/ 347
METRIC RANK
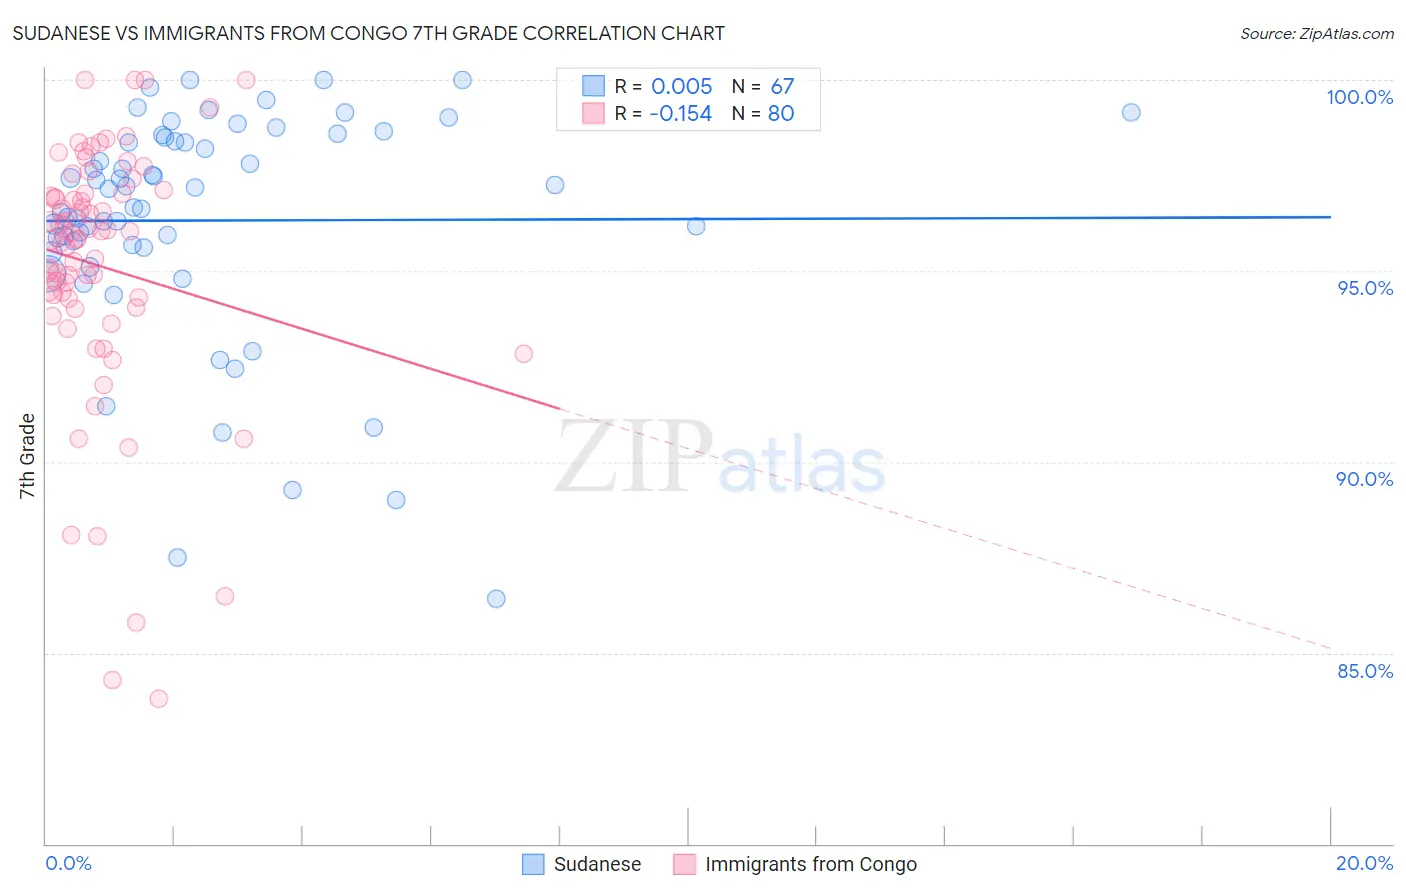
Sudanese vs Immigrants from Congo 7th Grade Correlation Chart
The statistical analysis conducted on geographies consisting of 110,134,719 people shows no correlation between the proportion of Sudanese and percentage of population with at least 7th grade education in the United States with a correlation coefficient (R) of 0.005 and weighted average of 95.9%. Similarly, the statistical analysis conducted on geographies consisting of 92,124,753 people shows a poor negative correlation between the proportion of Immigrants from Congo and percentage of population with at least 7th grade education in the United States with a correlation coefficient (R) of -0.154 and weighted average of 95.3%, a difference of 0.62%.
7th Grade Correlation Summary
| Measurement | Sudanese | Immigrants from Congo |
| Minimum | 86.4% | 83.8% |
| Maximum | 100.0% | 100.0% |
| Range | 13.6% | 16.2% |
| Mean | 96.3% | 95.1% |
| Median | 97.2% | 95.9% |
| Interquartile 25% (IQ1) | 95.6% | 94.2% |
| Interquartile 75% (IQ3) | 98.5% | 97.0% |
| Interquartile Range (IQR) | 2.9% | 2.9% |
| Standard Deviation (Sample) | 3.0% | 3.4% |
| Standard Deviation (Population) | 3.0% | 3.4% |
Similar Demographics by 7th Grade
Demographics Similar to Sudanese by 7th Grade
In terms of 7th grade, the demographic groups most similar to Sudanese are Apache (95.9%, a difference of 0.0%), Immigrants from Nepal (95.9%, a difference of 0.010%), Immigrants from Zaire (95.9%, a difference of 0.010%), Immigrants from Bahamas (95.9%, a difference of 0.020%), and Immigrants from Micronesia (95.9%, a difference of 0.030%).
| Demographics | Rating | Rank | 7th Grade |
| Immigrants | Egypt | 34.3 /100 | #188 | Fair 95.9% |
| Immigrants | Venezuela | 33.9 /100 | #189 | Fair 95.9% |
| Immigrants | Micronesia | 32.6 /100 | #190 | Fair 95.9% |
| Liberians | 32.5 /100 | #191 | Fair 95.9% |
| Panamanians | 32.3 /100 | #192 | Fair 95.9% |
| Immigrants | Bahamas | 30.8 /100 | #193 | Fair 95.9% |
| Immigrants | Nepal | 30.0 /100 | #194 | Fair 95.9% |
| Sudanese | 28.1 /100 | #195 | Fair 95.9% |
| Apache | 27.6 /100 | #196 | Fair 95.9% |
| Immigrants | Zaire | 26.7 /100 | #197 | Fair 95.9% |
| Paraguayans | 24.8 /100 | #198 | Fair 95.9% |
| Guamanians/Chamorros | 23.5 /100 | #199 | Fair 95.9% |
| Argentineans | 23.2 /100 | #200 | Fair 95.9% |
| Immigrants | Argentina | 21.9 /100 | #201 | Fair 95.9% |
| Immigrants | Northern Africa | 21.4 /100 | #202 | Fair 95.8% |
Demographics Similar to Immigrants from Congo by 7th Grade
In terms of 7th grade, the demographic groups most similar to Immigrants from Congo are Immigrants from China (95.3%, a difference of 0.0%), Ghanaian (95.3%, a difference of 0.0%), Korean (95.3%, a difference of 0.010%), Colombian (95.3%, a difference of 0.020%), and Somali (95.3%, a difference of 0.030%).
| Demographics | Rating | Rank | 7th Grade |
| Immigrants | Cameroon | 0.9 /100 | #250 | Tragic 95.4% |
| Immigrants | Jamaica | 0.9 /100 | #251 | Tragic 95.4% |
| Immigrants | Ethiopia | 0.9 /100 | #252 | Tragic 95.3% |
| Somalis | 0.9 /100 | #253 | Tragic 95.3% |
| Colombians | 0.8 /100 | #254 | Tragic 95.3% |
| Koreans | 0.8 /100 | #255 | Tragic 95.3% |
| Immigrants | China | 0.7 /100 | #256 | Tragic 95.3% |
| Immigrants | Congo | 0.7 /100 | #257 | Tragic 95.3% |
| Ghanaians | 0.7 /100 | #258 | Tragic 95.3% |
| Immigrants | Costa Rica | 0.6 /100 | #259 | Tragic 95.3% |
| Afghans | 0.5 /100 | #260 | Tragic 95.3% |
| South Americans | 0.5 /100 | #261 | Tragic 95.2% |
| Immigrants | Somalia | 0.5 /100 | #262 | Tragic 95.2% |
| West Indians | 0.5 /100 | #263 | Tragic 95.2% |
| Immigrants | Nigeria | 0.4 /100 | #264 | Tragic 95.2% |