Swedish vs Immigrants from Cuba Professional Degree
COMPARE
Swedish
Immigrants from Cuba
Professional Degree
Professional Degree Comparison
Swedes
Immigrants from Cuba
4.5%
PROFESSIONAL DEGREE
69.9/ 100
METRIC RATING
156th/ 347
METRIC RANK
3.6%
PROFESSIONAL DEGREE
0.6/ 100
METRIC RATING
269th/ 347
METRIC RANK
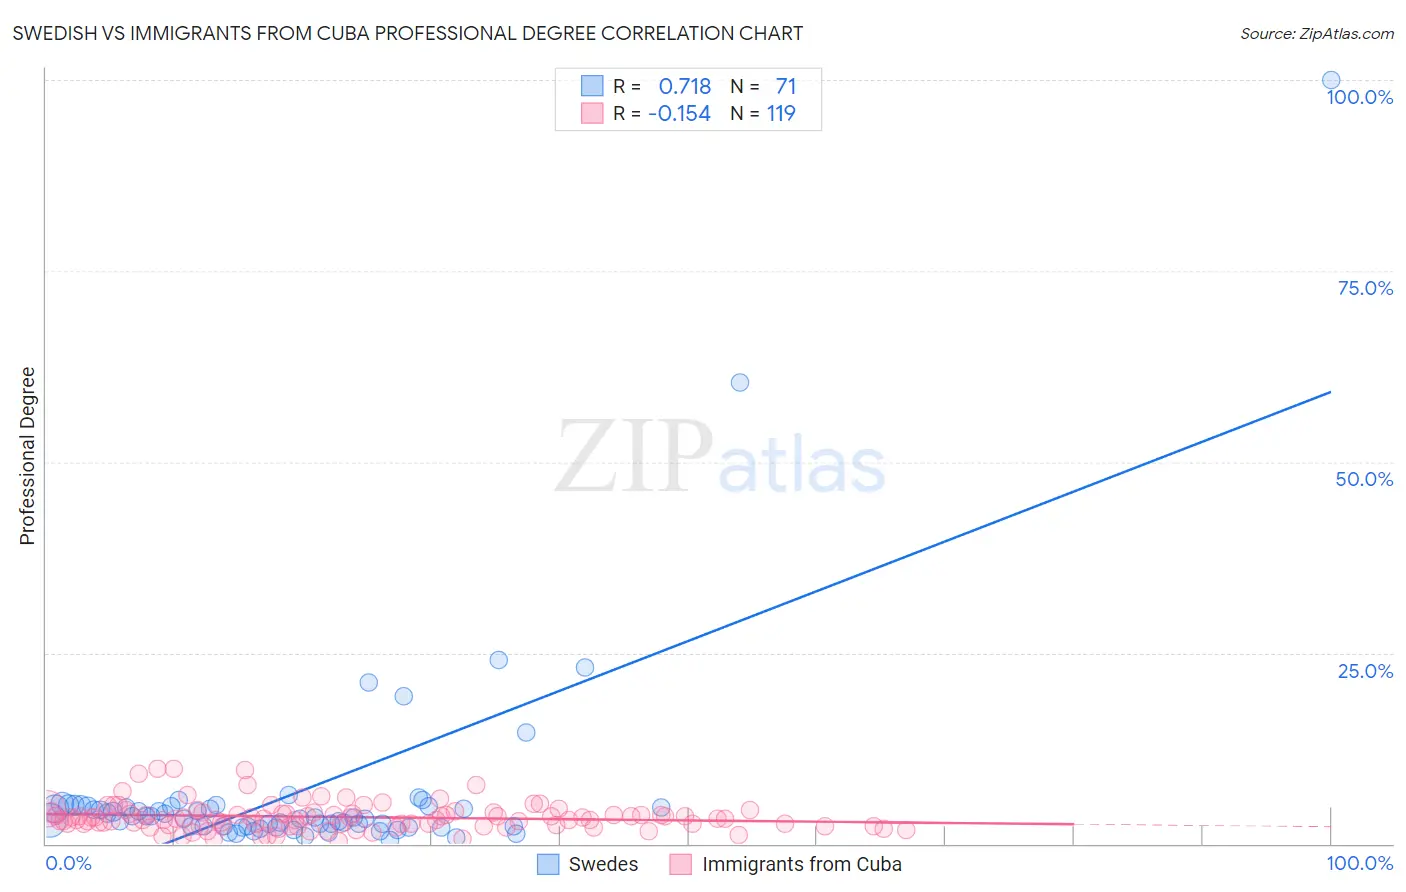
Swedish vs Immigrants from Cuba Professional Degree Correlation Chart
The statistical analysis conducted on geographies consisting of 533,979,460 people shows a strong positive correlation between the proportion of Swedes and percentage of population with at least professional degree education in the United States with a correlation coefficient (R) of 0.718 and weighted average of 4.5%. Similarly, the statistical analysis conducted on geographies consisting of 325,367,242 people shows a poor negative correlation between the proportion of Immigrants from Cuba and percentage of population with at least professional degree education in the United States with a correlation coefficient (R) of -0.154 and weighted average of 3.6%, a difference of 26.3%.
Professional Degree Correlation Summary
| Measurement | Swedish | Immigrants from Cuba |
| Minimum | 0.57% | 0.31% |
| Maximum | 100.0% | 9.9% |
| Range | 99.4% | 9.6% |
| Mean | 6.7% | 3.5% |
| Median | 3.5% | 3.2% |
| Interquartile 25% (IQ1) | 2.3% | 2.4% |
| Interquartile 75% (IQ3) | 5.0% | 4.0% |
| Interquartile Range (IQR) | 2.7% | 1.6% |
| Standard Deviation (Sample) | 13.9% | 1.8% |
| Standard Deviation (Population) | 13.8% | 1.8% |
Similar Demographics by Professional Degree
Demographics Similar to Swedes by Professional Degree
In terms of professional degree, the demographic groups most similar to Swedes are Iraqi (4.5%, a difference of 0.010%), Slavic (4.5%, a difference of 0.15%), Immigrants from Armenia (4.5%, a difference of 0.18%), Vietnamese (4.5%, a difference of 0.26%), and Immigrants from Senegal (4.5%, a difference of 0.32%).
| Demographics | Rating | Rank | Professional Degree |
| Senegalese | 75.3 /100 | #149 | Good 4.6% |
| Immigrants | Oceania | 73.4 /100 | #150 | Good 4.6% |
| Poles | 72.6 /100 | #151 | Good 4.6% |
| Immigrants | Africa | 72.5 /100 | #152 | Good 4.6% |
| Immigrants | Uruguay | 72.5 /100 | #153 | Good 4.6% |
| Scottish | 71.8 /100 | #154 | Good 4.6% |
| Slavs | 70.8 /100 | #155 | Good 4.5% |
| Swedes | 69.9 /100 | #156 | Good 4.5% |
| Iraqis | 69.8 /100 | #157 | Good 4.5% |
| Immigrants | Armenia | 68.8 /100 | #158 | Good 4.5% |
| Vietnamese | 68.4 /100 | #159 | Good 4.5% |
| Immigrants | Senegal | 68.0 /100 | #160 | Good 4.5% |
| Assyrians/Chaldeans/Syriacs | 67.4 /100 | #161 | Good 4.5% |
| Peruvians | 65.2 /100 | #162 | Good 4.5% |
| Sierra Leoneans | 64.3 /100 | #163 | Good 4.5% |
Demographics Similar to Immigrants from Cuba by Professional Degree
In terms of professional degree, the demographic groups most similar to Immigrants from Cuba are Central American (3.6%, a difference of 0.29%), Aleut (3.6%, a difference of 0.60%), Delaware (3.6%, a difference of 0.75%), Belizean (3.6%, a difference of 0.76%), and Immigrants from Jamaica (3.6%, a difference of 0.78%).
| Demographics | Rating | Rank | Professional Degree |
| U.S. Virgin Islanders | 1.0 /100 | #262 | Tragic 3.7% |
| Hopi | 0.9 /100 | #263 | Tragic 3.6% |
| Immigrants | Cambodia | 0.9 /100 | #264 | Tragic 3.6% |
| Immigrants | Congo | 0.8 /100 | #265 | Tragic 3.6% |
| Central American Indians | 0.8 /100 | #266 | Tragic 3.6% |
| Delaware | 0.7 /100 | #267 | Tragic 3.6% |
| Aleuts | 0.7 /100 | #268 | Tragic 3.6% |
| Immigrants | Cuba | 0.6 /100 | #269 | Tragic 3.6% |
| Central Americans | 0.6 /100 | #270 | Tragic 3.6% |
| Belizeans | 0.5 /100 | #271 | Tragic 3.6% |
| Immigrants | Jamaica | 0.5 /100 | #272 | Tragic 3.6% |
| Americans | 0.5 /100 | #273 | Tragic 3.6% |
| Potawatomi | 0.5 /100 | #274 | Tragic 3.6% |
| Immigrants | Dominica | 0.5 /100 | #275 | Tragic 3.6% |
| Liberians | 0.5 /100 | #276 | Tragic 3.6% |