Syrian vs West Indian Professional Degree
COMPARE
Syrian
West Indian
Professional Degree
Professional Degree Comparison
Syrians
West Indians
5.2%
PROFESSIONAL DEGREE
99.1/ 100
METRIC RATING
97th/ 347
METRIC RANK
4.1%
PROFESSIONAL DEGREE
9.8/ 100
METRIC RATING
216th/ 347
METRIC RANK
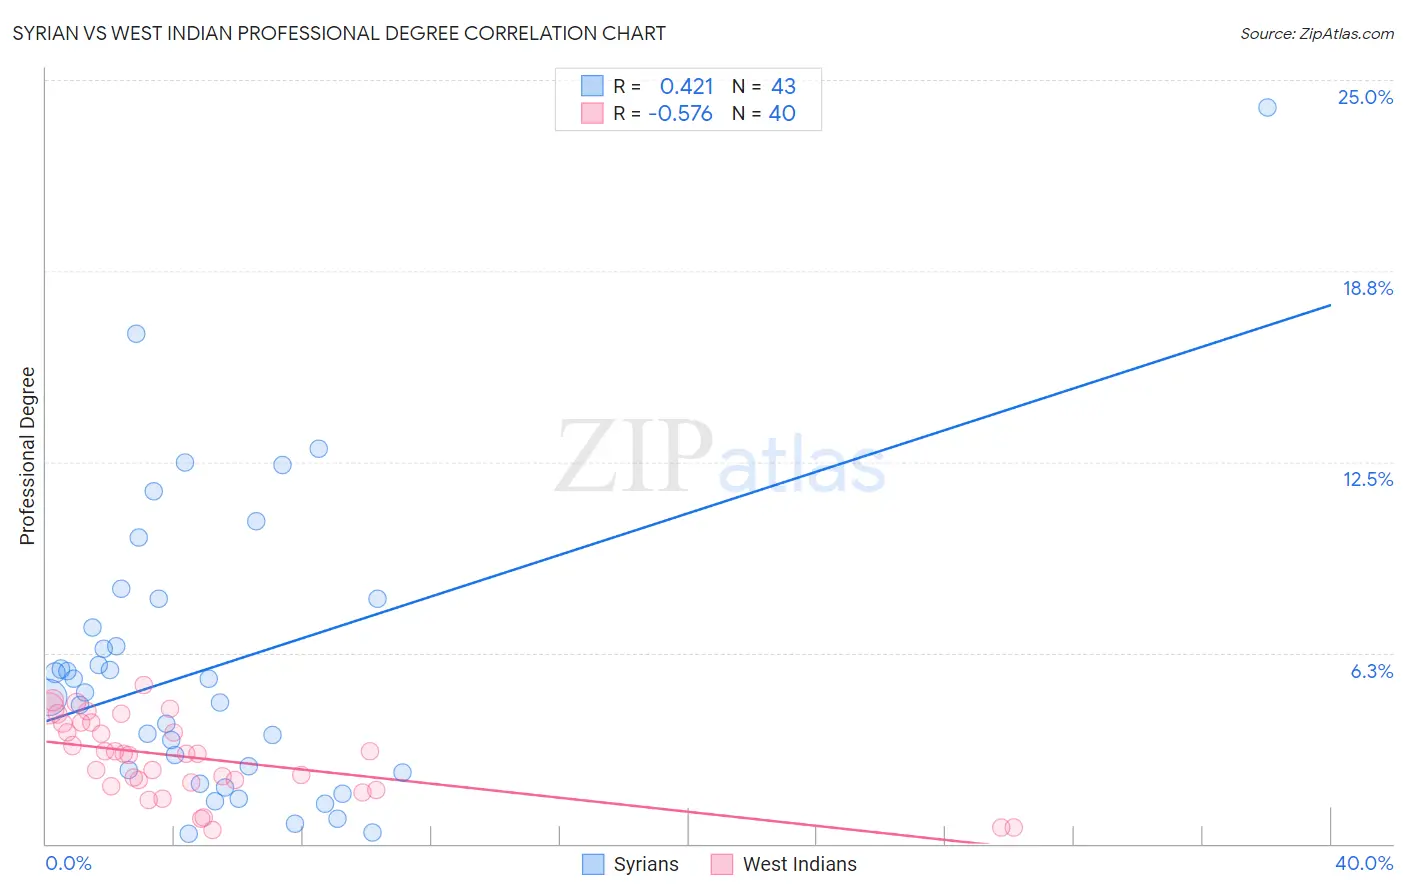
Syrian vs West Indian Professional Degree Correlation Chart
The statistical analysis conducted on geographies consisting of 266,047,589 people shows a moderate positive correlation between the proportion of Syrians and percentage of population with at least professional degree education in the United States with a correlation coefficient (R) of 0.421 and weighted average of 5.2%. Similarly, the statistical analysis conducted on geographies consisting of 253,709,742 people shows a substantial negative correlation between the proportion of West Indians and percentage of population with at least professional degree education in the United States with a correlation coefficient (R) of -0.576 and weighted average of 4.1%, a difference of 27.4%.
Professional Degree Correlation Summary
| Measurement | Syrian | West Indian |
| Minimum | 0.32% | 0.46% |
| Maximum | 24.1% | 5.2% |
| Range | 23.8% | 4.7% |
| Mean | 5.8% | 2.8% |
| Median | 5.0% | 2.9% |
| Interquartile 25% (IQ1) | 2.3% | 1.9% |
| Interquartile 75% (IQ3) | 8.0% | 3.9% |
| Interquartile Range (IQR) | 5.7% | 2.0% |
| Standard Deviation (Sample) | 4.8% | 1.3% |
| Standard Deviation (Population) | 4.7% | 1.3% |
Similar Demographics by Professional Degree
Demographics Similar to Syrians by Professional Degree
In terms of professional degree, the demographic groups most similar to Syrians are Austrian (5.2%, a difference of 0.020%), Immigrants from Italy (5.2%, a difference of 0.080%), Immigrants from Uzbekistan (5.2%, a difference of 0.35%), Zimbabwean (5.2%, a difference of 0.75%), and Ugandan (5.1%, a difference of 0.85%).
| Demographics | Rating | Rank | Professional Degree |
| Immigrants | Scotland | 99.5 /100 | #90 | Exceptional 5.3% |
| Laotians | 99.5 /100 | #91 | Exceptional 5.2% |
| Immigrants | Eastern Europe | 99.5 /100 | #92 | Exceptional 5.2% |
| Northern Europeans | 99.3 /100 | #93 | Exceptional 5.2% |
| Alsatians | 99.3 /100 | #94 | Exceptional 5.2% |
| Zimbabweans | 99.3 /100 | #95 | Exceptional 5.2% |
| Immigrants | Uzbekistan | 99.2 /100 | #96 | Exceptional 5.2% |
| Syrians | 99.1 /100 | #97 | Exceptional 5.2% |
| Austrians | 99.1 /100 | #98 | Exceptional 5.2% |
| Immigrants | Italy | 99.1 /100 | #99 | Exceptional 5.2% |
| Ugandans | 98.8 /100 | #100 | Exceptional 5.1% |
| Immigrants | Egypt | 98.5 /100 | #101 | Exceptional 5.1% |
| Ukrainians | 98.5 /100 | #102 | Exceptional 5.1% |
| Immigrants | Northern Africa | 98.4 /100 | #103 | Exceptional 5.1% |
| Arabs | 98.2 /100 | #104 | Exceptional 5.0% |
Demographics Similar to West Indians by Professional Degree
In terms of professional degree, the demographic groups most similar to West Indians are Immigrants from Vietnam (4.0%, a difference of 0.16%), Portuguese (4.1%, a difference of 0.31%), Immigrants from Ghana (4.1%, a difference of 0.37%), Dutch (4.0%, a difference of 0.37%), and Immigrants from South Eastern Asia (4.0%, a difference of 0.40%).
| Demographics | Rating | Rank | Professional Degree |
| Immigrants | Panama | 12.3 /100 | #209 | Poor 4.1% |
| Immigrants | Nigeria | 11.7 /100 | #210 | Poor 4.1% |
| Germans | 11.6 /100 | #211 | Poor 4.1% |
| Whites/Caucasians | 11.2 /100 | #212 | Poor 4.1% |
| Koreans | 10.7 /100 | #213 | Poor 4.1% |
| Immigrants | Ghana | 10.6 /100 | #214 | Poor 4.1% |
| Portuguese | 10.5 /100 | #215 | Poor 4.1% |
| West Indians | 9.8 /100 | #216 | Tragic 4.1% |
| Immigrants | Vietnam | 9.4 /100 | #217 | Tragic 4.0% |
| Dutch | 9.0 /100 | #218 | Tragic 4.0% |
| Immigrants | South Eastern Asia | 8.9 /100 | #219 | Tragic 4.0% |
| Ute | 8.2 /100 | #220 | Tragic 4.0% |
| French Canadians | 8.0 /100 | #221 | Tragic 4.0% |
| Immigrants | Western Africa | 7.5 /100 | #222 | Tragic 4.0% |
| Immigrants | Bosnia and Herzegovina | 7.4 /100 | #223 | Tragic 4.0% |