Turkish vs African College, Under 1 year
COMPARE
Turkish
African
College, Under 1 year
College, Under 1 year Comparison
Turks
Africans
70.7%
COLLEGE, UNDER 1 YEAR
99.9/ 100
METRIC RATING
32nd/ 347
METRIC RANK
61.1%
COLLEGE, UNDER 1 YEAR
0.3/ 100
METRIC RATING
261st/ 347
METRIC RANK
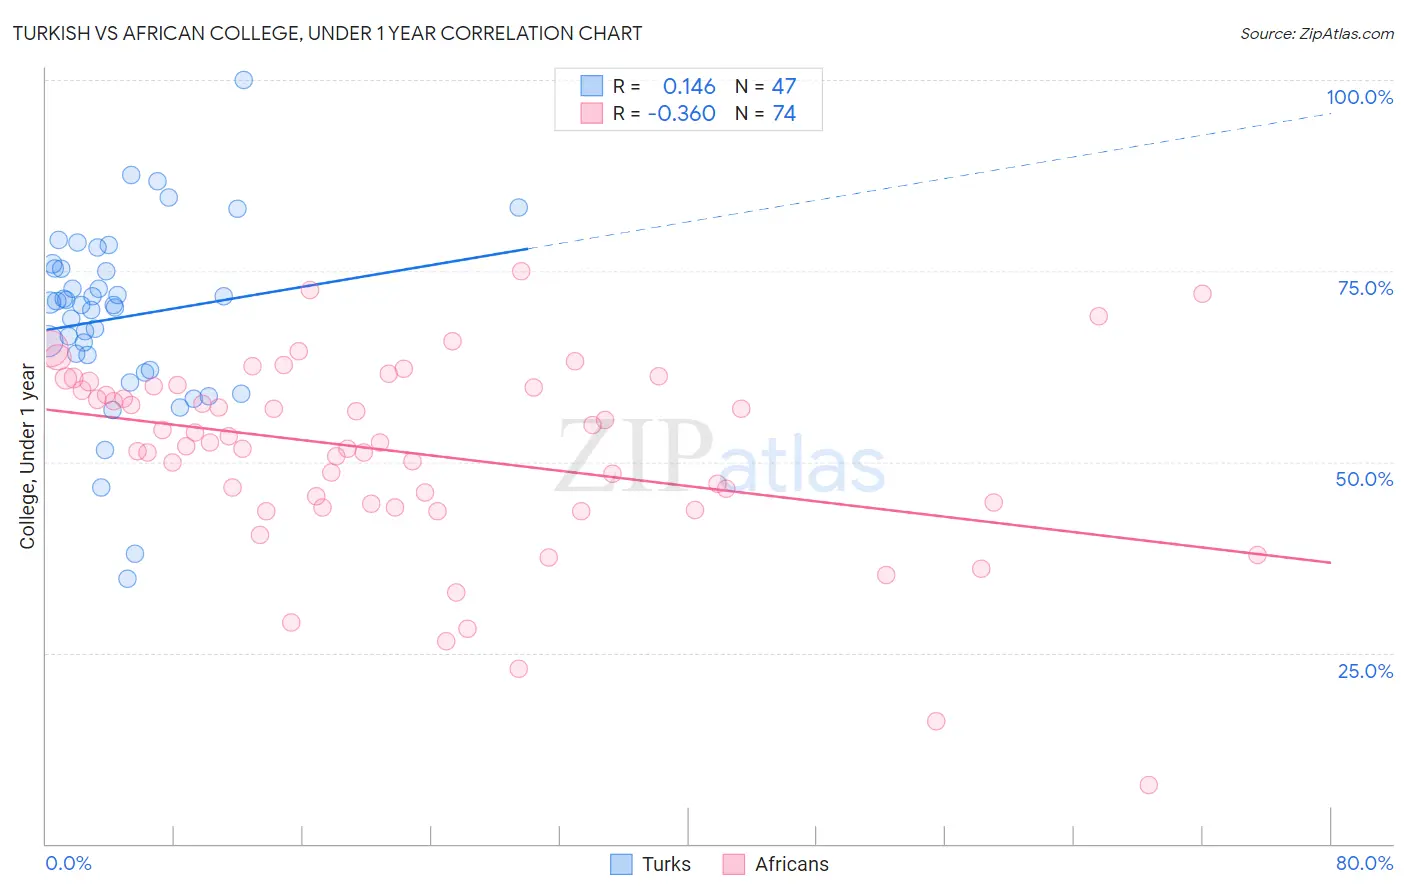
Turkish vs African College, Under 1 year Correlation Chart
The statistical analysis conducted on geographies consisting of 271,864,133 people shows a poor positive correlation between the proportion of Turks and percentage of population with at least college, under 1 year education in the United States with a correlation coefficient (R) of 0.146 and weighted average of 70.7%. Similarly, the statistical analysis conducted on geographies consisting of 470,092,177 people shows a mild negative correlation between the proportion of Africans and percentage of population with at least college, under 1 year education in the United States with a correlation coefficient (R) of -0.360 and weighted average of 61.1%, a difference of 15.7%.
College, Under 1 year Correlation Summary
| Measurement | Turkish | African |
| Minimum | 34.7% | 7.7% |
| Maximum | 100.0% | 75.0% |
| Range | 65.3% | 67.3% |
| Mean | 69.0% | 51.2% |
| Median | 70.5% | 52.5% |
| Interquartile 25% (IQ1) | 62.0% | 44.5% |
| Interquartile 75% (IQ3) | 75.3% | 59.9% |
| Interquartile Range (IQR) | 13.3% | 15.4% |
| Standard Deviation (Sample) | 12.1% | 12.7% |
| Standard Deviation (Population) | 11.9% | 12.6% |
Similar Demographics by College, Under 1 year
Demographics Similar to Turks by College, Under 1 year
In terms of college, under 1 year, the demographic groups most similar to Turks are Indian (Asian) (70.8%, a difference of 0.080%), Immigrants from South Africa (70.6%, a difference of 0.17%), Estonian (70.6%, a difference of 0.18%), Immigrants from China (70.9%, a difference of 0.19%), and Russian (70.5%, a difference of 0.27%).
| Demographics | Rating | Rank | College, Under 1 year |
| Bulgarians | 100.0 /100 | #25 | Exceptional 71.1% |
| Immigrants | Denmark | 100.0 /100 | #26 | Exceptional 71.0% |
| Immigrants | Ireland | 100.0 /100 | #27 | Exceptional 71.0% |
| Immigrants | Hong Kong | 100.0 /100 | #28 | Exceptional 71.0% |
| Immigrants | France | 100.0 /100 | #29 | Exceptional 71.0% |
| Immigrants | China | 99.9 /100 | #30 | Exceptional 70.9% |
| Indians (Asian) | 99.9 /100 | #31 | Exceptional 70.8% |
| Turks | 99.9 /100 | #32 | Exceptional 70.7% |
| Immigrants | South Africa | 99.9 /100 | #33 | Exceptional 70.6% |
| Estonians | 99.9 /100 | #34 | Exceptional 70.6% |
| Russians | 99.9 /100 | #35 | Exceptional 70.5% |
| Immigrants | Sri Lanka | 99.9 /100 | #36 | Exceptional 70.5% |
| Immigrants | Saudi Arabia | 99.9 /100 | #37 | Exceptional 70.4% |
| Australians | 99.9 /100 | #38 | Exceptional 70.4% |
| Bhutanese | 99.9 /100 | #39 | Exceptional 70.3% |
Demographics Similar to Africans by College, Under 1 year
In terms of college, under 1 year, the demographic groups most similar to Africans are Blackfeet (61.1%, a difference of 0.030%), Barbadian (61.1%, a difference of 0.040%), Shoshone (61.1%, a difference of 0.050%), Trinidadian and Tobagonian (61.1%, a difference of 0.11%), and Immigrants from Bahamas (61.1%, a difference of 0.11%).
| Demographics | Rating | Rank | College, Under 1 year |
| Immigrants | Cambodia | 0.4 /100 | #254 | Tragic 61.5% |
| Comanche | 0.4 /100 | #255 | Tragic 61.4% |
| Bangladeshis | 0.4 /100 | #256 | Tragic 61.4% |
| Immigrants | Laos | 0.3 /100 | #257 | Tragic 61.3% |
| Immigrants | Bangladesh | 0.3 /100 | #258 | Tragic 61.3% |
| Indonesians | 0.3 /100 | #259 | Tragic 61.2% |
| Blackfeet | 0.3 /100 | #260 | Tragic 61.1% |
| Africans | 0.3 /100 | #261 | Tragic 61.1% |
| Barbadians | 0.2 /100 | #262 | Tragic 61.1% |
| Shoshone | 0.2 /100 | #263 | Tragic 61.1% |
| Trinidadians and Tobagonians | 0.2 /100 | #264 | Tragic 61.1% |
| Immigrants | Bahamas | 0.2 /100 | #265 | Tragic 61.1% |
| Alaskan Athabascans | 0.2 /100 | #266 | Tragic 61.0% |
| Americans | 0.2 /100 | #267 | Tragic 61.0% |
| Immigrants | Trinidad and Tobago | 0.1 /100 | #268 | Tragic 60.7% |