Ute vs Arapaho GED/Equivalency
COMPARE
Ute
Arapaho
GED/Equivalency
GED/Equivalency Comparison
Ute
Arapaho
81.8%
GED/EQUIVALENCY
0.0/ 100
METRIC RATING
298th/ 347
METRIC RANK
82.8%
GED/EQUIVALENCY
0.1/ 100
METRIC RATING
277th/ 347
METRIC RANK
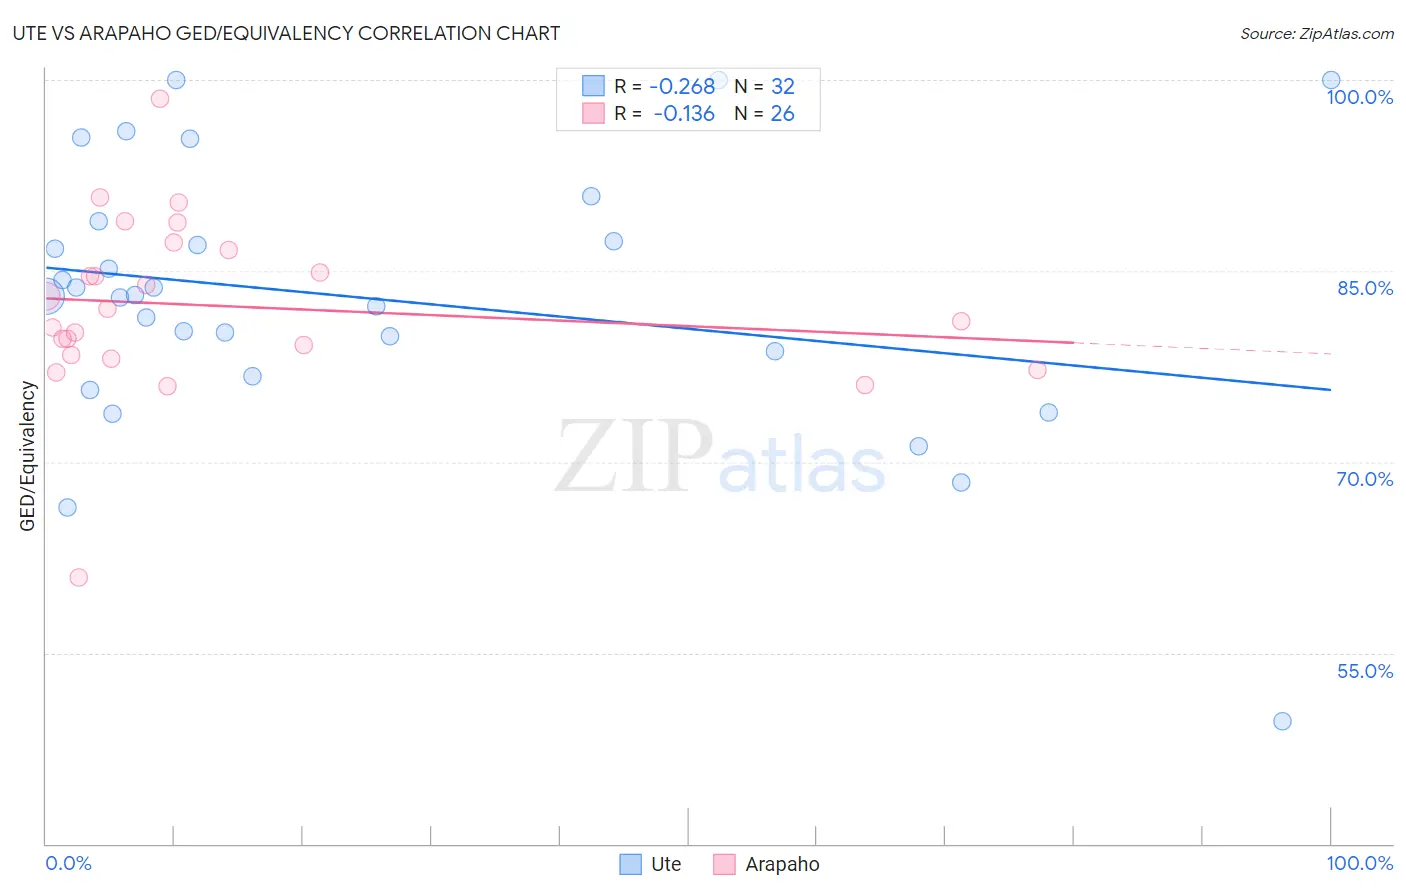
Ute vs Arapaho GED/Equivalency Correlation Chart
The statistical analysis conducted on geographies consisting of 55,668,599 people shows a weak negative correlation between the proportion of Ute and percentage of population with at least ged/equivalency education in the United States with a correlation coefficient (R) of -0.268 and weighted average of 81.8%. Similarly, the statistical analysis conducted on geographies consisting of 29,780,040 people shows a poor negative correlation between the proportion of Arapaho and percentage of population with at least ged/equivalency education in the United States with a correlation coefficient (R) of -0.136 and weighted average of 82.8%, a difference of 1.2%.
GED/Equivalency Correlation Summary
| Measurement | Ute | Arapaho |
| Minimum | 49.6% | 60.9% |
| Maximum | 100.0% | 98.5% |
| Range | 50.4% | 37.6% |
| Mean | 82.9% | 82.2% |
| Median | 83.0% | 81.5% |
| Interquartile 25% (IQ1) | 77.7% | 78.4% |
| Interquartile 75% (IQ3) | 88.1% | 86.6% |
| Interquartile Range (IQR) | 10.4% | 8.2% |
| Standard Deviation (Sample) | 10.7% | 6.9% |
| Standard Deviation (Population) | 10.5% | 6.8% |
Similar Demographics by GED/Equivalency
Demographics Similar to Ute by GED/Equivalency
In terms of ged/equivalency, the demographic groups most similar to Ute are Immigrants from Bangladesh (81.9%, a difference of 0.090%), Vietnamese (81.9%, a difference of 0.14%), Ecuadorian (81.7%, a difference of 0.14%), Nepalese (81.9%, a difference of 0.17%), and Fijian (81.6%, a difference of 0.20%).
| Demographics | Rating | Rank | GED/Equivalency |
| Cubans | 0.0 /100 | #291 | Tragic 82.0% |
| Paiute | 0.0 /100 | #292 | Tragic 82.0% |
| British West Indians | 0.0 /100 | #293 | Tragic 82.0% |
| Immigrants | St. Vincent and the Grenadines | 0.0 /100 | #294 | Tragic 82.0% |
| Nepalese | 0.0 /100 | #295 | Tragic 81.9% |
| Vietnamese | 0.0 /100 | #296 | Tragic 81.9% |
| Immigrants | Bangladesh | 0.0 /100 | #297 | Tragic 81.9% |
| Ute | 0.0 /100 | #298 | Tragic 81.8% |
| Ecuadorians | 0.0 /100 | #299 | Tragic 81.7% |
| Fijians | 0.0 /100 | #300 | Tragic 81.6% |
| Dutch West Indians | 0.0 /100 | #301 | Tragic 81.6% |
| Immigrants | Haiti | 0.0 /100 | #302 | Tragic 81.6% |
| Immigrants | Portugal | 0.0 /100 | #303 | Tragic 81.6% |
| Navajo | 0.0 /100 | #304 | Tragic 81.5% |
| Immigrants | Grenada | 0.0 /100 | #305 | Tragic 81.3% |
Demographics Similar to Arapaho by GED/Equivalency
In terms of ged/equivalency, the demographic groups most similar to Arapaho are Black/African American (82.8%, a difference of 0.020%), Immigrants from Laos (82.7%, a difference of 0.030%), Seminole (82.8%, a difference of 0.040%), Immigrants from Fiji (82.7%, a difference of 0.040%), and Cheyenne (82.7%, a difference of 0.050%).
| Demographics | Rating | Rank | GED/Equivalency |
| Immigrants | Jamaica | 0.2 /100 | #270 | Tragic 82.9% |
| U.S. Virgin Islanders | 0.2 /100 | #271 | Tragic 82.9% |
| Barbadians | 0.1 /100 | #272 | Tragic 82.9% |
| Pennsylvania Germans | 0.1 /100 | #273 | Tragic 82.9% |
| Immigrants | Trinidad and Tobago | 0.1 /100 | #274 | Tragic 82.8% |
| Seminole | 0.1 /100 | #275 | Tragic 82.8% |
| Blacks/African Americans | 0.1 /100 | #276 | Tragic 82.8% |
| Arapaho | 0.1 /100 | #277 | Tragic 82.8% |
| Immigrants | Laos | 0.1 /100 | #278 | Tragic 82.7% |
| Immigrants | Fiji | 0.1 /100 | #279 | Tragic 82.7% |
| Cheyenne | 0.1 /100 | #280 | Tragic 82.7% |
| Sioux | 0.1 /100 | #281 | Tragic 82.6% |
| Immigrants | Immigrants | 0.1 /100 | #282 | Tragic 82.6% |
| Indonesians | 0.1 /100 | #283 | Tragic 82.5% |
| Immigrants | Barbados | 0.1 /100 | #284 | Tragic 82.4% |