West Indian vs Native/Alaskan Master's Degree
COMPARE
West Indian
Native/Alaskan
Master's Degree
Master's Degree Comparison
West Indians
Natives/Alaskans
14.5%
MASTER'S DEGREE
27.4/ 100
METRIC RATING
198th/ 347
METRIC RANK
9.9%
MASTER'S DEGREE
0.0/ 100
METRIC RATING
336th/ 347
METRIC RANK
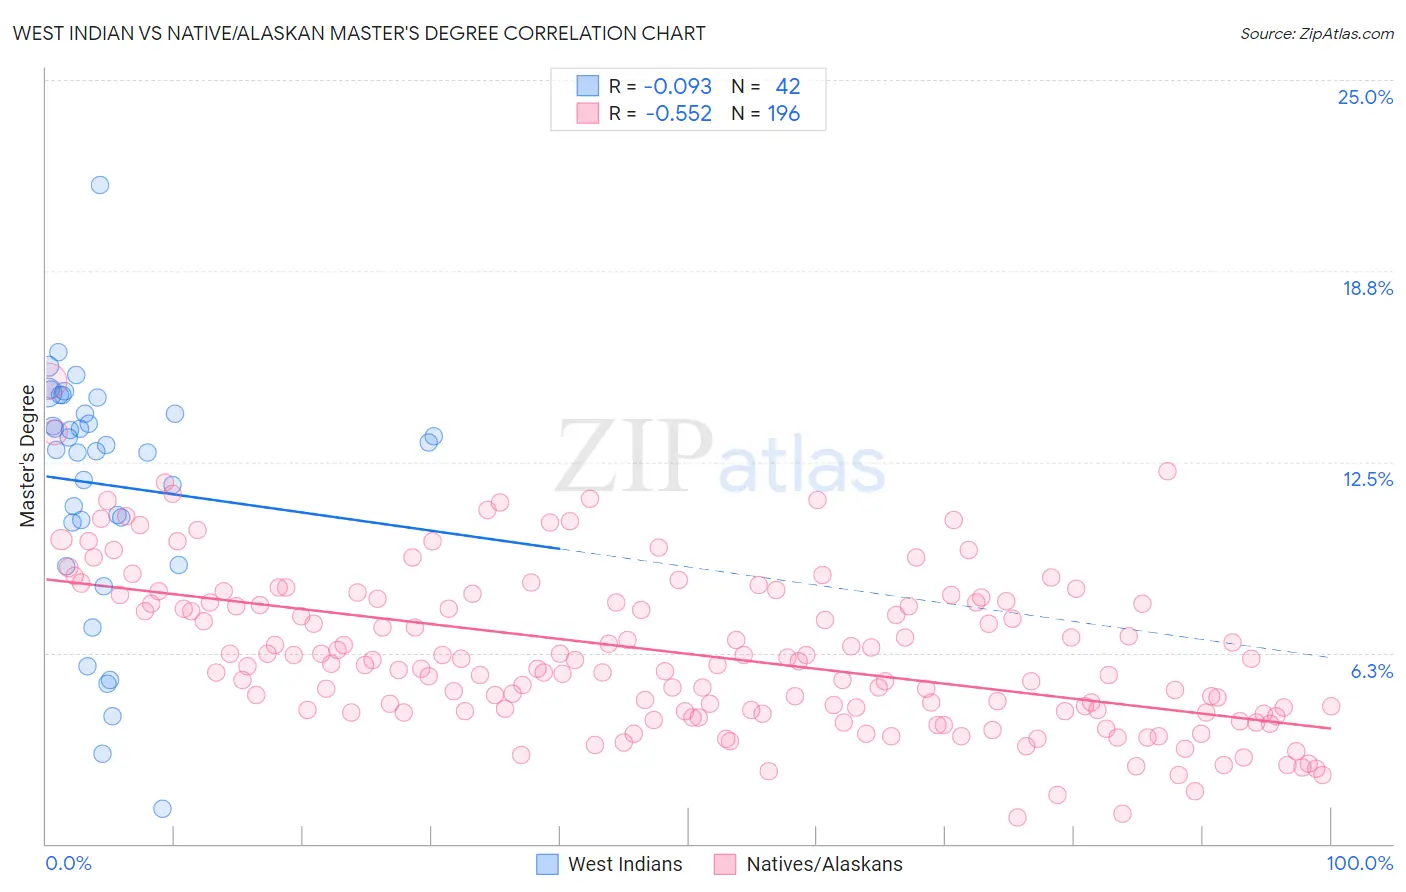
West Indian vs Native/Alaskan Master's Degree Correlation Chart
The statistical analysis conducted on geographies consisting of 253,991,340 people shows a slight negative correlation between the proportion of West Indians and percentage of population with at least master's degree education in the United States with a correlation coefficient (R) of -0.093 and weighted average of 14.5%. Similarly, the statistical analysis conducted on geographies consisting of 512,468,242 people shows a substantial negative correlation between the proportion of Natives/Alaskans and percentage of population with at least master's degree education in the United States with a correlation coefficient (R) of -0.552 and weighted average of 9.9%, a difference of 45.5%.
Master's Degree Correlation Summary
| Measurement | West Indian | Native/Alaskan |
| Minimum | 1.1% | 0.88% |
| Maximum | 21.6% | 15.1% |
| Range | 20.4% | 14.3% |
| Mean | 11.7% | 6.2% |
| Median | 13.0% | 5.9% |
| Interquartile 25% (IQ1) | 10.5% | 4.3% |
| Interquartile 75% (IQ3) | 14.1% | 7.9% |
| Interquartile Range (IQR) | 3.6% | 3.6% |
| Standard Deviation (Sample) | 4.0% | 2.6% |
| Standard Deviation (Population) | 4.0% | 2.6% |
Similar Demographics by Master's Degree
Demographics Similar to West Indians by Master's Degree
In terms of master's degree, the demographic groups most similar to West Indians are Immigrants from Armenia (14.5%, a difference of 0.040%), Belgian (14.5%, a difference of 0.10%), Panamanian (14.4%, a difference of 0.40%), Czechoslovakian (14.5%, a difference of 0.41%), and Scotch-Irish (14.4%, a difference of 0.41%).
| Demographics | Rating | Rank | Master's Degree |
| Welsh | 34.2 /100 | #191 | Fair 14.6% |
| Immigrants | Middle Africa | 33.6 /100 | #192 | Fair 14.6% |
| Immigrants | Nigeria | 32.7 /100 | #193 | Fair 14.6% |
| Chinese | 32.5 /100 | #194 | Fair 14.6% |
| Danes | 31.3 /100 | #195 | Fair 14.5% |
| Czechoslovakians | 29.9 /100 | #196 | Fair 14.5% |
| Belgians | 28.0 /100 | #197 | Fair 14.5% |
| West Indians | 27.4 /100 | #198 | Fair 14.5% |
| Immigrants | Armenia | 27.2 /100 | #199 | Fair 14.5% |
| Panamanians | 25.1 /100 | #200 | Fair 14.4% |
| Scotch-Irish | 25.0 /100 | #201 | Fair 14.4% |
| Immigrants | Western Africa | 24.9 /100 | #202 | Fair 14.4% |
| Yugoslavians | 24.3 /100 | #203 | Fair 14.4% |
| French | 23.7 /100 | #204 | Fair 14.4% |
| Trinidadians and Tobagonians | 23.5 /100 | #205 | Fair 14.4% |
Demographics Similar to Natives/Alaskans by Master's Degree
In terms of master's degree, the demographic groups most similar to Natives/Alaskans are Immigrants from Central America (10.0%, a difference of 0.50%), Arapaho (10.0%, a difference of 0.64%), Mexican (9.7%, a difference of 2.2%), Tohono O'odham (9.7%, a difference of 2.3%), and Menominee (10.2%, a difference of 2.6%).
| Demographics | Rating | Rank | Master's Degree |
| Nepalese | 0.0 /100 | #329 | Tragic 10.5% |
| Fijians | 0.0 /100 | #330 | Tragic 10.3% |
| Pueblo | 0.0 /100 | #331 | Tragic 10.3% |
| Immigrants | Azores | 0.0 /100 | #332 | Tragic 10.2% |
| Menominee | 0.0 /100 | #333 | Tragic 10.2% |
| Arapaho | 0.0 /100 | #334 | Tragic 10.0% |
| Immigrants | Central America | 0.0 /100 | #335 | Tragic 10.0% |
| Natives/Alaskans | 0.0 /100 | #336 | Tragic 9.9% |
| Mexicans | 0.0 /100 | #337 | Tragic 9.7% |
| Tohono O'odham | 0.0 /100 | #338 | Tragic 9.7% |
| Spanish American Indians | 0.0 /100 | #339 | Tragic 9.6% |
| Yakama | 0.0 /100 | #340 | Tragic 9.5% |
| Navajo | 0.0 /100 | #341 | Tragic 9.4% |
| Immigrants | Mexico | 0.0 /100 | #342 | Tragic 9.3% |
| Lumbee | 0.0 /100 | #343 | Tragic 9.3% |