Yakama vs Yup'ik 11th Grade
COMPARE
Yakama
Yup'ik
11th Grade
11th Grade Comparison
Yakama
Yup'ik
85.0%
11TH GRADE
0.0/ 100
METRIC RATING
344th/ 347
METRIC RANK
91.2%
11TH GRADE
0.3/ 100
METRIC RATING
264th/ 347
METRIC RANK
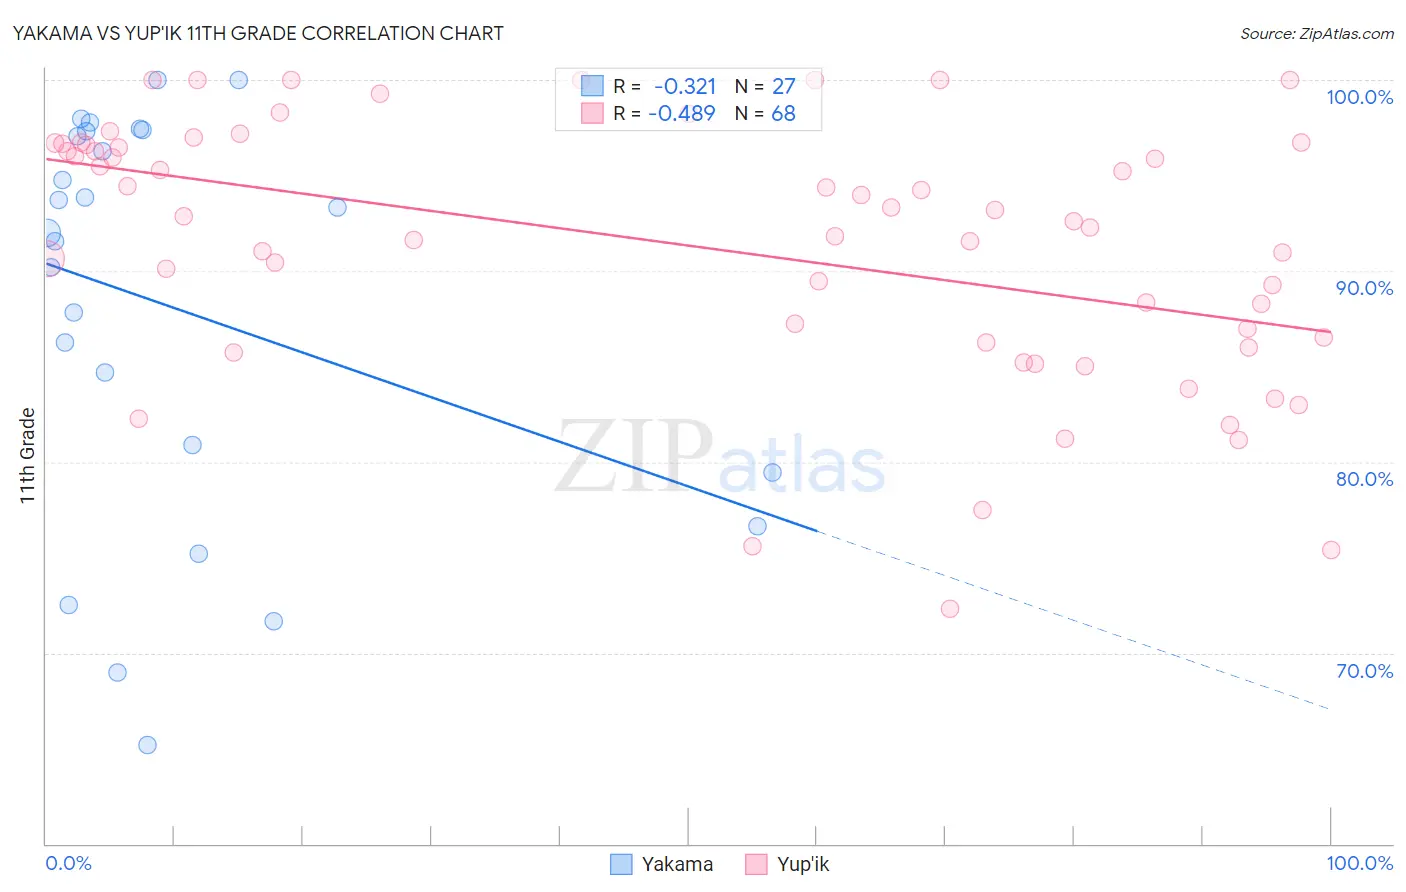
Yakama vs Yup'ik 11th Grade Correlation Chart
The statistical analysis conducted on geographies consisting of 19,923,144 people shows a mild negative correlation between the proportion of Yakama and percentage of population with at least 11th grade education in the United States with a correlation coefficient (R) of -0.321 and weighted average of 85.0%. Similarly, the statistical analysis conducted on geographies consisting of 39,964,654 people shows a moderate negative correlation between the proportion of Yup'ik and percentage of population with at least 11th grade education in the United States with a correlation coefficient (R) of -0.489 and weighted average of 91.2%, a difference of 7.3%.
11th Grade Correlation Summary
| Measurement | Yakama | Yup'ik |
| Minimum | 65.2% | 72.3% |
| Maximum | 100.0% | 100.0% |
| Range | 34.8% | 27.7% |
| Mean | 88.1% | 91.3% |
| Median | 92.0% | 92.7% |
| Interquartile 25% (IQ1) | 79.5% | 86.4% |
| Interquartile 75% (IQ3) | 97.3% | 96.7% |
| Interquartile Range (IQR) | 17.9% | 10.3% |
| Standard Deviation (Sample) | 10.5% | 6.8% |
| Standard Deviation (Population) | 10.3% | 6.7% |
Similar Demographics by 11th Grade
Demographics Similar to Yakama by 11th Grade
In terms of 11th grade, the demographic groups most similar to Yakama are Immigrants from Central America (84.9%, a difference of 0.030%), Spanish American Indian (84.7%, a difference of 0.27%), Immigrants from El Salvador (85.3%, a difference of 0.40%), Immigrants from Mexico (84.5%, a difference of 0.57%), and Immigrants from Guatemala (85.8%, a difference of 1.0%).
| Demographics | Rating | Rank | 11th Grade |
| Immigrants | Yemen | 0.0 /100 | #333 | Tragic 87.1% |
| Houma | 0.0 /100 | #334 | Tragic 87.0% |
| Central Americans | 0.0 /100 | #335 | Tragic 86.9% |
| Immigrants | Dominican Republic | 0.0 /100 | #336 | Tragic 86.9% |
| Immigrants | Honduras | 0.0 /100 | #337 | Tragic 86.9% |
| Immigrants | Latin America | 0.0 /100 | #338 | Tragic 86.8% |
| Guatemalans | 0.0 /100 | #339 | Tragic 86.4% |
| Salvadorans | 0.0 /100 | #340 | Tragic 86.2% |
| Mexicans | 0.0 /100 | #341 | Tragic 86.1% |
| Immigrants | Guatemala | 0.0 /100 | #342 | Tragic 85.8% |
| Immigrants | El Salvador | 0.0 /100 | #343 | Tragic 85.3% |
| Yakama | 0.0 /100 | #344 | Tragic 85.0% |
| Immigrants | Central America | 0.0 /100 | #345 | Tragic 84.9% |
| Spanish American Indians | 0.0 /100 | #346 | Tragic 84.7% |
| Immigrants | Mexico | 0.0 /100 | #347 | Tragic 84.5% |
Demographics Similar to Yup'ik by 11th Grade
In terms of 11th grade, the demographic groups most similar to Yup'ik are Pueblo (91.2%, a difference of 0.0%), Immigrants from Ghana (91.2%, a difference of 0.020%), Immigrants from Western Africa (91.2%, a difference of 0.030%), Immigrants from Jamaica (91.2%, a difference of 0.030%), and U.S. Virgin Islander (91.1%, a difference of 0.11%).
| Demographics | Rating | Rank | 11th Grade |
| Cajuns | 0.7 /100 | #257 | Tragic 91.4% |
| Immigrants | Colombia | 0.6 /100 | #258 | Tragic 91.4% |
| Jamaicans | 0.6 /100 | #259 | Tragic 91.4% |
| Spanish Americans | 0.6 /100 | #260 | Tragic 91.4% |
| Taiwanese | 0.6 /100 | #261 | Tragic 91.3% |
| Immigrants | Uruguay | 0.5 /100 | #262 | Tragic 91.3% |
| Immigrants | Ghana | 0.3 /100 | #263 | Tragic 91.2% |
| Yup'ik | 0.3 /100 | #264 | Tragic 91.2% |
| Pueblo | 0.3 /100 | #265 | Tragic 91.2% |
| Immigrants | Western Africa | 0.3 /100 | #266 | Tragic 91.2% |
| Immigrants | Jamaica | 0.3 /100 | #267 | Tragic 91.2% |
| U.S. Virgin Islanders | 0.2 /100 | #268 | Tragic 91.1% |
| Ute | 0.2 /100 | #269 | Tragic 91.1% |
| Trinidadians and Tobagonians | 0.2 /100 | #270 | Tragic 91.1% |
| Immigrants | Peru | 0.1 /100 | #271 | Tragic 91.0% |