Yaqui vs Filipino Doctorate Degree
COMPARE
Yaqui
Filipino
Doctorate Degree
Doctorate Degree Comparison
Yaqui
Filipinos
1.5%
DOCTORATE DEGREE
0.4/ 100
METRIC RATING
274th/ 347
METRIC RANK
3.4%
DOCTORATE DEGREE
100.0/ 100
METRIC RATING
2nd/ 347
METRIC RANK
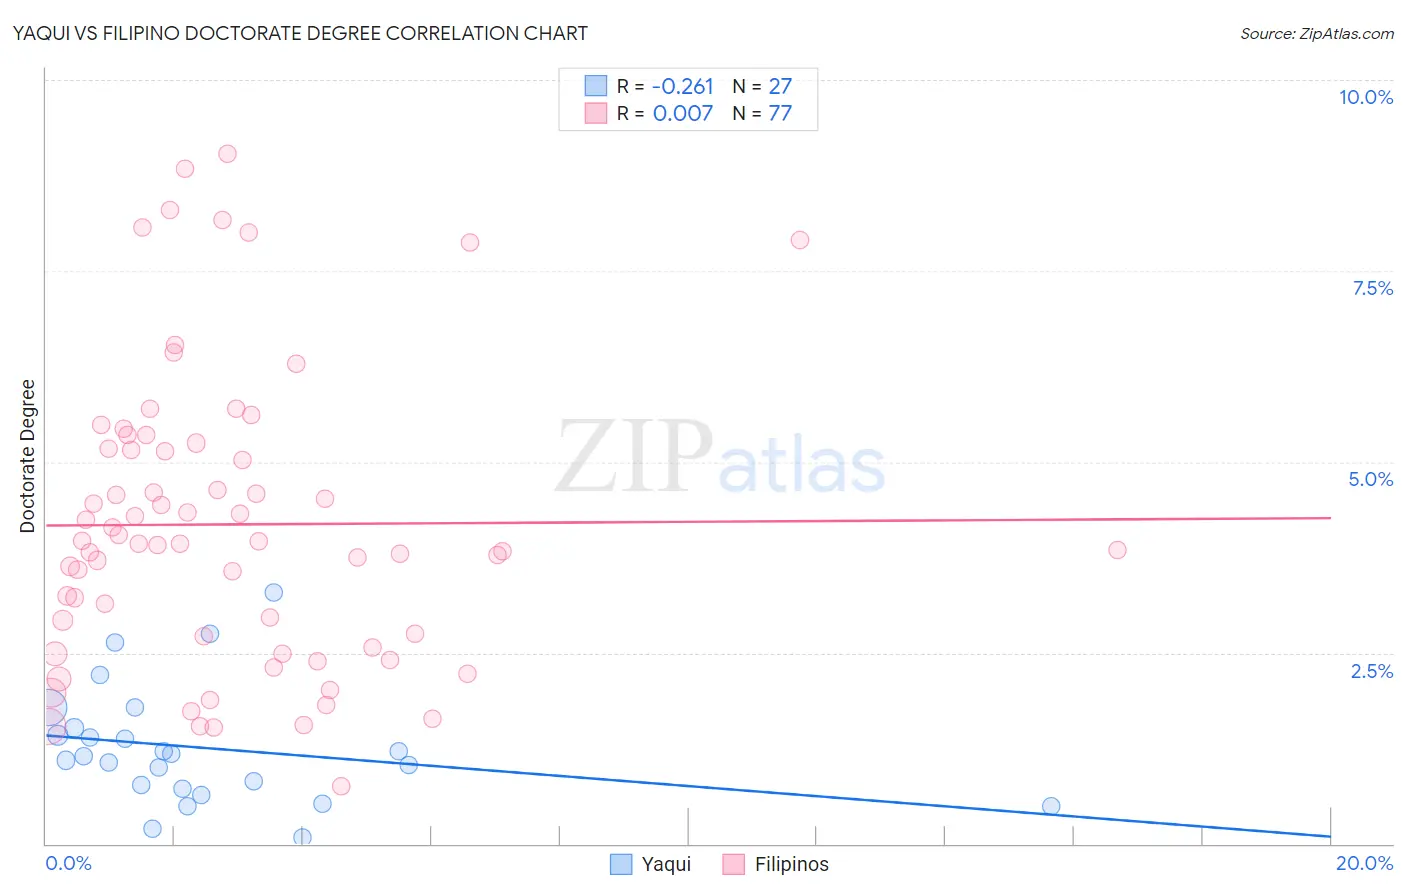
Yaqui vs Filipino Doctorate Degree Correlation Chart
The statistical analysis conducted on geographies consisting of 107,124,723 people shows a weak negative correlation between the proportion of Yaqui and percentage of population with at least doctorate degree education in the United States with a correlation coefficient (R) of -0.261 and weighted average of 1.5%. Similarly, the statistical analysis conducted on geographies consisting of 253,646,775 people shows no correlation between the proportion of Filipinos and percentage of population with at least doctorate degree education in the United States with a correlation coefficient (R) of 0.007 and weighted average of 3.4%, a difference of 133.3%.
Doctorate Degree Correlation Summary
| Measurement | Yaqui | Filipino |
| Minimum | 0.075% | 0.76% |
| Maximum | 3.3% | 9.0% |
| Range | 3.2% | 8.3% |
| Mean | 1.3% | 4.2% |
| Median | 1.1% | 3.9% |
| Interquartile 25% (IQ1) | 0.73% | 2.6% |
| Interquartile 75% (IQ3) | 1.5% | 5.2% |
| Interquartile Range (IQR) | 0.79% | 2.6% |
| Standard Deviation (Sample) | 0.77% | 1.9% |
| Standard Deviation (Population) | 0.76% | 1.9% |
Similar Demographics by Doctorate Degree
Demographics Similar to Yaqui by Doctorate Degree
In terms of doctorate degree, the demographic groups most similar to Yaqui are Sioux (1.5%, a difference of 0.020%), Aleut (1.5%, a difference of 0.12%), Immigrants from Barbados (1.5%, a difference of 0.13%), Paiute (1.5%, a difference of 0.17%), and Immigrants from Trinidad and Tobago (1.5%, a difference of 0.22%).
| Demographics | Rating | Rank | Doctorate Degree |
| Kiowa | 0.5 /100 | #267 | Tragic 1.5% |
| U.S. Virgin Islanders | 0.5 /100 | #268 | Tragic 1.5% |
| Crow | 0.5 /100 | #269 | Tragic 1.5% |
| Salvadorans | 0.5 /100 | #270 | Tragic 1.5% |
| Immigrants | Trinidad and Tobago | 0.5 /100 | #271 | Tragic 1.5% |
| Immigrants | Barbados | 0.4 /100 | #272 | Tragic 1.5% |
| Sioux | 0.4 /100 | #273 | Tragic 1.5% |
| Yaqui | 0.4 /100 | #274 | Tragic 1.5% |
| Aleuts | 0.4 /100 | #275 | Tragic 1.5% |
| Paiute | 0.4 /100 | #276 | Tragic 1.5% |
| Bahamians | 0.4 /100 | #277 | Tragic 1.5% |
| Hawaiians | 0.4 /100 | #278 | Tragic 1.5% |
| Marshallese | 0.4 /100 | #279 | Tragic 1.5% |
| Ecuadorians | 0.4 /100 | #280 | Tragic 1.5% |
| Tohono O'odham | 0.4 /100 | #281 | Tragic 1.5% |
Demographics Similar to Filipinos by Doctorate Degree
In terms of doctorate degree, the demographic groups most similar to Filipinos are Okinawan (3.3%, a difference of 4.7%), Immigrants from Singapore (3.7%, a difference of 7.2%), Immigrants from Taiwan (3.2%, a difference of 7.4%), Iranian (3.1%, a difference of 9.1%), and Immigrants from Switzerland (3.1%, a difference of 11.2%).
| Demographics | Rating | Rank | Doctorate Degree |
| Immigrants | Singapore | 100.0 /100 | #1 | Exceptional 3.7% |
| Filipinos | 100.0 /100 | #2 | Exceptional 3.4% |
| Okinawans | 100.0 /100 | #3 | Exceptional 3.3% |
| Immigrants | Taiwan | 100.0 /100 | #4 | Exceptional 3.2% |
| Iranians | 100.0 /100 | #5 | Exceptional 3.1% |
| Immigrants | Switzerland | 100.0 /100 | #6 | Exceptional 3.1% |
| Immigrants | China | 100.0 /100 | #7 | Exceptional 3.1% |
| Immigrants | Israel | 100.0 /100 | #8 | Exceptional 3.0% |
| Immigrants | Iran | 100.0 /100 | #9 | Exceptional 3.0% |
| Immigrants | Eastern Asia | 100.0 /100 | #10 | Exceptional 3.0% |
| Indians (Asian) | 100.0 /100 | #11 | Exceptional 2.9% |
| Immigrants | Belgium | 100.0 /100 | #12 | Exceptional 2.9% |
| Immigrants | Sweden | 100.0 /100 | #13 | Exceptional 2.9% |
| Immigrants | France | 100.0 /100 | #14 | Exceptional 2.9% |
| Immigrants | India | 100.0 /100 | #15 | Exceptional 2.8% |